Data Products: Hurricane Intensity Estimation
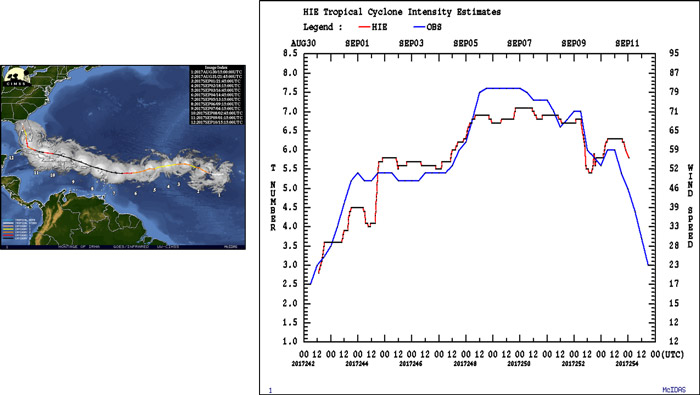
The hurricane intensity algorithm makes use of the ABI longwave infrared window band to monitor changes in the cloud top temperature near the tropical cyclone center. An analysis of the cloud top temperature field over the tropical cyclone center, together with a cloud pattern recognition analysis, enables the retrieval of an intensity estimate for the tropical cyclone valid at the time of the ABI image. The tropical storm intensity estimate is output as maximum sustained one-minute surface winds (Kts), and minimum sea level pressure (MSLP) at the center (hPa) of the tropical storm. Hurricane intensity estimates provide critical guidance to forecasters at tropical cyclone forecast centers regarding tropical cyclone storm intensity from storm formation, through development and maturation, to dissipation.