New Tools for Monitoring Hurricanes in a Changing Climate
May 23, 2019
The 2019 Atlantic hurricane season begins on June 1. The National Oceanic and Atmospheric Administration’s (NOAA‘s) Climate Prediction Center is forecasting a near-normal Atlantic hurricane season. For 2019, NOAA predicts a likely range of 9 to 15 named storms (winds of 39 mph or higher), of which 4 to 8 could become hurricanes (winds of 74 mph or higher), including 2 to 4 major hurricanes (category 3, 4 or 5; with winds of 111 mph or higher).
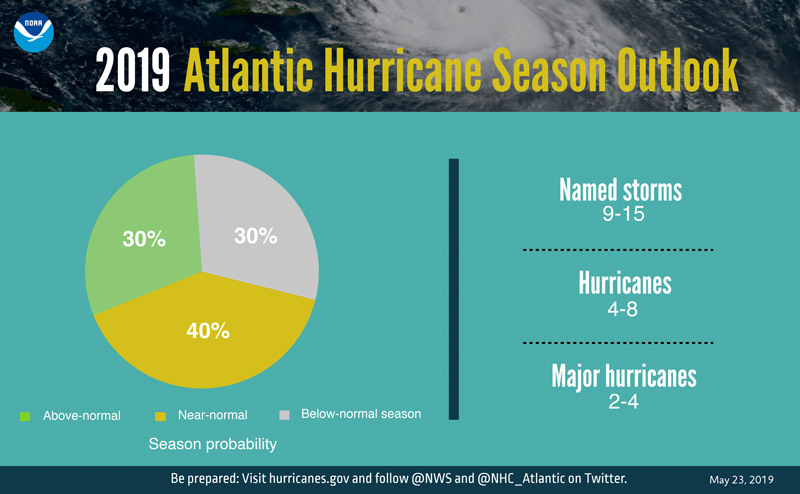
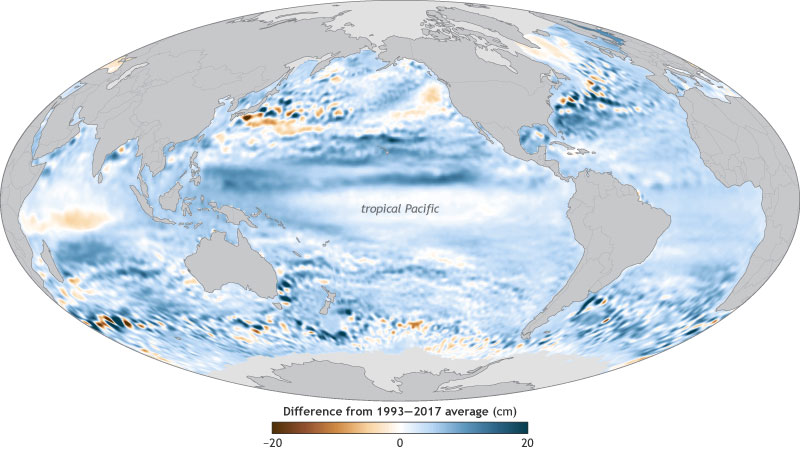
This outlook reflects competing climate factors. The ongoing El Nino is expected to persist and suppress the intensity of the hurricane season. Countering El Nino is the expected combination of warmer-than-average sea-surface temperatures in the tropical Atlantic Ocean and Caribbean Sea, and an enhanced west African monsoon, both of which favor increased hurricane activity.
In addition to the Atlantic hurricane season outlook, NOAA also issued the seasonal hurricane outlook for the central Pacific basin. The Central Pacific Hurricane Center announced a 70% chance of above-normal tropical cyclone activity during the central Pacific hurricane season this year and predicted 5 to 8 tropical cyclones for the central Pacific basin.
Hurricanes in a warming climate
A warming climate is expected to impact sea level rise, storm surge, tropical cyclone rainfall rates, and tropical cyclone intensity. Sea level rise is expected to cause higher storm surge levels when a tropical cyclone does occur, and tropical cyclone rainfall rates will likely increase. In addition, the intensity of tropical cyclones is likely to increase globally, with a greater proportion of tropical cyclones reaching Category 4 and 5. Warmer air creates warmer sea surface temperatures, which provide more energy for storms to strengthen.
We are also seeing a pattern of slower storms, remaining stationary over a location for longer periods of time and increasing flooding impacts. As the Earth becomes warmer, the atmospheric circulation that drives cyclone movement can weaken, slowing down or stalling storms. A recent study showed that between 1949 and 2016 global tropical cyclone speed slowed by about 10%. A 10% slower storm in a warming planet can double the increase in rainfall, and worsen dangerous flooding conditions.
This isn’t great news for the millions of people in the paths of hurricanes each year. Fortunately, we have two new advanced geostationary satellites, NOAA’s Geostationary Operational Environmental Satellite (GOES)-16 and GOES-17 that continuously view the entire Atlantic and eastern/central Pacific hurricane basins. The latest generation of GOES carry sophisticated instruments that provide new and dramatically improved capabilities for forecasting, tracking and monitoring hurricanes as well as the environmental conditions that cause them to form.
Monitoring the conditions that spawn hurricanes
Hurricanes are fueled by energy fluxes from the ocean that depend on the temperature of the water. Sea surface temperatures (SSTs) can indicate how strong a hurricane may become. Satellites are crucial to these observations, as outside of sporadic buoys and ship reports, there are no other ways of estimating SST. The GOES-R Series provides a notable improvement in monitoring SST compared to previous GOES, such as better characterization of smaller-scale ocean eddies (circular currents of water). The improvements result from the new Advanced Baseline Imager (ABI) instrument, which has more spectral channels available to derive the SSTs, significantly improved resolution, and much faster scanning than the previous GOES imager.
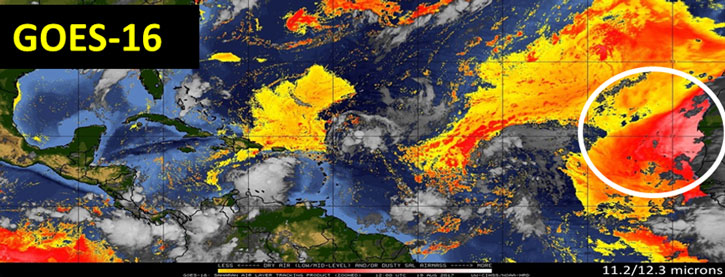
The presence of a strong Saharan Air Layer (SAL), a dry and sometimes dust-laden layer of the troposphere that often stabilizes the environment around tropical systems as it traverses across the Atlantic Ocean basin, has been shown to influence Atlantic hurricane activity. Most of the properties associated with the SAL deter hurricane development. Therefore, characterizing this air mass in extent and strength is important to intensity forecasts. Multispectral products from GOES-16 created by combining multiple ABI channels improve forecasters’ ability to define the boundaries and intensity of the SAL.
Real-time hurricane tracking
The ABI is able to scan a targeted area of interest as often as every 30 seconds, providing unprecedented real-time monitoring of a storm from space. Faster image frequency allows forecasters to more easily discern the movement of cloud features and provides greater confidence in estimating the center of the storm and its wind speeds. The added confidence in locating the center of circulation also helps guide reconnaissance aircraft (“hurricane hunters”) to the correct location.
GOES-16 proved vital in forecasting operations for Hurricane Maria as it neared Puerto Rico on September 20, 2017. The storm knocked out the radar in San Juan just before Maria made landfall on the island. Land-based radar is used during storms to provide detailed information on hurricane wind fields, rain intensity, and storm position and movement. With this critical technology disabled and a major hurricane approaching, forecasters were able to utilize GOES-16 to monitor the storm in real time.
New information for diagnosing storm properties
ABI has additional channels not available from previous GOES. New infrared channels help forecasters determine how cold cloud tops are and how rapidly they are cooling, which aids predictions for rainfall intensity and potential flash flooding associated with hurricane rain bands. For instance, a new “clean” longwave infrared window channel is used to monitor cloud characteristics and hurricane eye temperatures. Infrared imagery from GOES-16 helps forecasters analyze cloud features and patterns in near-real time, allowing for crucial estimates of central pressure and maximum sustained winds.
Intensity estimation
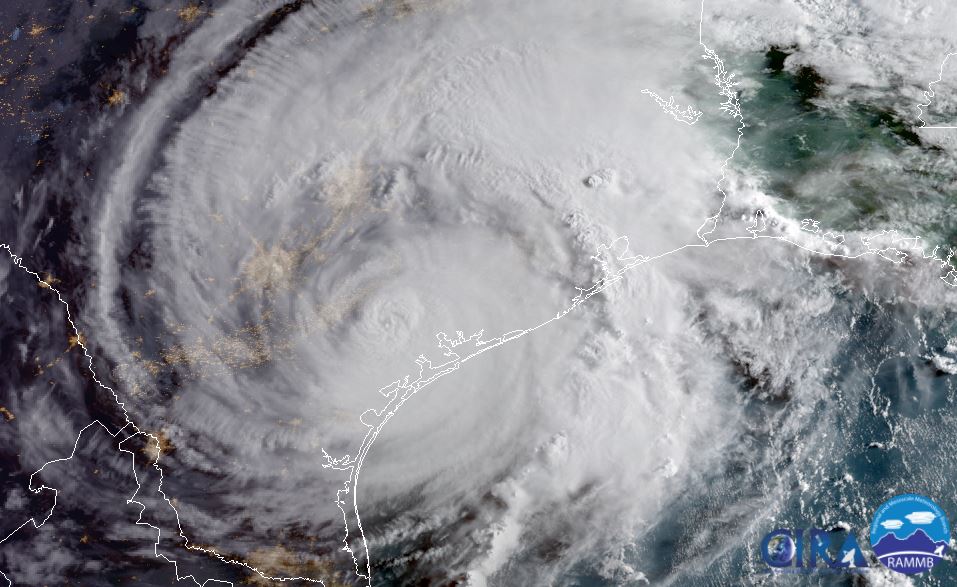
Rapid-scan imagery of intense hurricanes just prior to or during landfall can improve the ability to observe quickly evolving changes in the storm’s intensity and convective structure during this critical part of the warning process. The improved resolution of the ABI also helps forecasters better identify storm features and analyze intensity of a hurricane. For example, the finer detail available of a hurricane’s emerging eye is key to estimating intensity. Even subtle details in the storm’s convective organization or the emergence of an eye can alert forecasters of impending intensity fluctuations.
On September 9, 2018, Hurricane Florence was a weak Category 1 hurricane predicted to intensify as it approached the U.S. East Coast. Aircraft reconnaissance data were not yet available, so National Hurricane Center forecasters relied heavily on GOES-16 high-resolution imagery to monitor Florence’s organization. On this day, an eye was first observed, signaling a significant increase in organization that was followed by rapid intensification to a Category 4 major hurricane.
The ability to characterize the wind fields in and around a hurricane is crucial to predicting future storm motion and intensity. Atmospheric motion vectors (AMVs) are estimates of the wind, determined by tracking clouds and moisture features in successive images. The improved spatial resolution and faster scanning from the ABI enables higher quantity and quality of AMV wind estimates. These AMVs are then fed to numerical weather prediction models to improve the initial analyses, which leads to better forecasts.
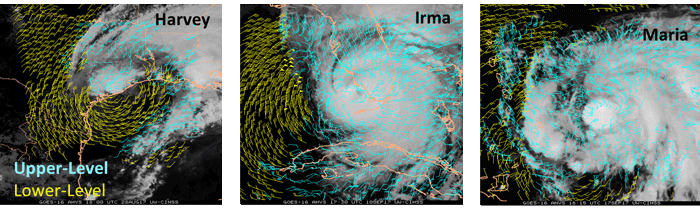
Research has shown that lightning can correlate with hurricane intensity changes. GOES-R Series satellites carry a Geostationary Lightning Mapper (GLM), the first operational lightning mapper flown in geostationary orbit. This new capability is enhancing the observation of lightning activity in hurricanes, providing higher detection efficiency, including continuous observations of total lightning (in-cloud and cloud-to-ground), and better observations over ocean. GLM can help forecasters predict future hurricane rapid intensification up to 24 hours ahead of time. For example, during Hurricane Maria in 2017, GLM observed frequent lightning in the eyewall, and specifically some activity just inside the radius of the storm’s maximum winds.
Assisting emergency response
When a catastrophic storm hits, the resulting floods can be deadly and cost billions of dollars in economic losses. In the U.S., floods are responsible for more loss of life and property than any other severe weather event.
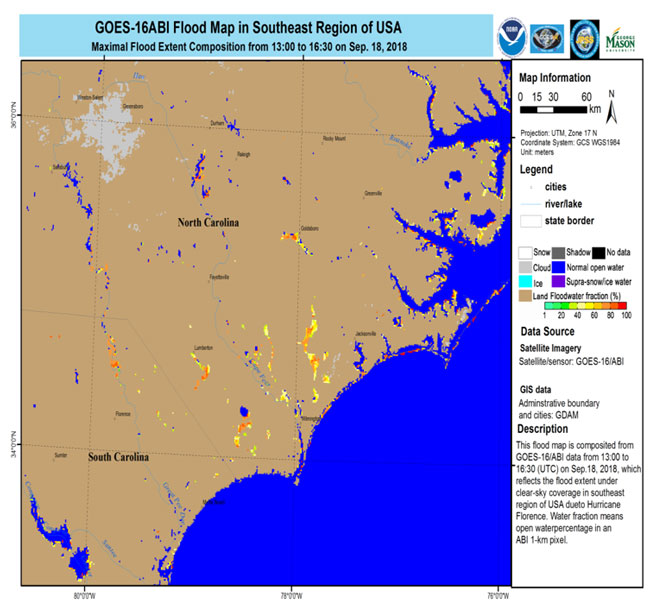
New NOAA flood map products, developed by scientists at George Mason University with NOAA support, use data from NOAA-NASA Suomi NPP, NOAA-20, GOES-16 and GOES-17 satellite imagers. The maps, along with aircraft, unmanned drones, and ground assets help determine the impact of a storm. They give the Federal Emergency Management Agency (FEMA), local emergency managers, and first responders important information about the location and extent of flooding associated with land falling hurricanes, how long it will last, and what damage the flood is causing. The maps allow officials to quickly determine where to employ limited resources during a flood. They also allow for insight into where water is receding and when it’s safe for people to return to their homes.
The flood maps have proved useful during hurricanes that produced major flooding, like Harvey and Irma in 2017 and Florence in 2018.
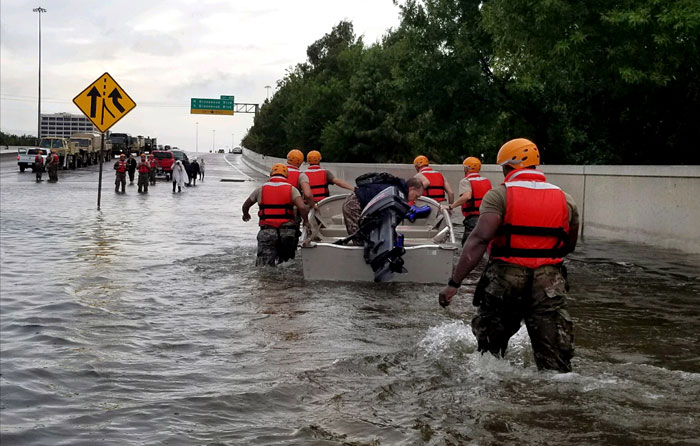
Hurricane Harvey rapidly intensified into a Category 4 hurricane before making landfall along the central Texas coast on August 25, 2017. The storm then stalled, with its center near the Texas coast for four days. Harvey dropped historic amounts of rainfall over the area, exceeding 60 inches in some locations.
As Hurricane Harvey parked over Texas, causing torrential downpours and flooding, National Weather Service personnel used GOES-16 data to provide decision support to emergency managers. As Harvey made landfall, forecasters in Corpus Christi, Texas, tracked the eyewall in real time to alert emergency managers when they would have a window of opportunity as the eyewall was passing over the region to evacuate dozens of people to safety before the back end of the hurricane struck. Along with radar, the enhanced information available from GOES-16 was helpful in determining the exact locations that were safe for public movement, and how much time before the back end of the storm would arrive.
Unprecedented capabilities for monitoring hurricanes
Hurricanes are one of the most menacing natural hazards, especially for island and coastal populations. Our changing climate may lead to even greater impacts in the near future. Continuous monitoring of these events as they unfold is essential for forecasters, especially as storms bear down on hazard-prone areas. This hurricane season, we have GOES-16 watching the Atlantic hurricane basin and GOES-17 keeping an eye on the eastern Pacific and central Pacific basins. New and upgraded instrumentation and data products from the GOES-R Series provide early warning that a hurricane is forming, and improve observation and monitoring of these ferocious storms. This vital information can help forecasters better understand and predict the behavior of hurricanes, improving public safety and protecting life and property.
Thanks to NOAA’s Climate Prediction Center, Geophysical Fluid Dynamics Laboratory, National Centers for Environmental Information, the Cooperative Institute for Climate and Satellites-Maryland, the Cooperative Institute for Research in the Atmosphere, the Cooperative Institute for Meteorological Satellite Studies, Christopher Velden, James Kossin, Sanmei Li, and Donglian Sun for research, information, data and imagery that contributed to this article.