GOES-17 ABI Performance
Summary of Cooling System Issue:
During post-launch testing of the GOES-17 ABI instrument, an issue with the instrument’s cooling system was discovered. The loop heat pipe (LHP) subsystem, which transfers heat from the ABI electronics to the radiator, is not operating at its designed capacity. The consequence of this is that the ABI detectors cannot be maintained at their intended temperatures under certain orbital conditions. Inadequate cooling of the infrared channels leads to partial loss of imagery during some of the overnight hours before and after the vernal and autumnal equinoxes.
Infrared signals with long wavelengths can be swamped by infrared light emitted by warm parts of the imager, degrading the signal. Cooling the detectors reduces this thermal “noise” in observations. During some nighttime hours during certain parts of the year (before and after the vernal and autumnal equinoxes), the sun heats up seven of the ABI detectors faster than they can be cooled. The detectors become warmer than they’re designed to operate, and they begin to radiate at temperatures closer to the wavelengths they’re attempting to detect from the Earth. Eventually, local emissions and dark current noise overwhelm the signal from the Earth, and the channels saturate, meaning a useful signal is not available.
Extraordinary recovery efforts greatly improved data availability from the GOES-17 ABI. Engineers and scientists continue to assess the instrument’s performance. As of April 2021, the instrument is delivering 94% of the data it was intended to provide. This decrease in data availability, from a peak of 98% after instrument recovery efforts, was expected due to graduation degradation of the ABI cryocooler and thermal surfaces over time. The team will continue to assess ABI performance and provide updates on when to expect degraded imagery due to saturated channels. GOES-17 is observing with more channels, at a higher resolution, and with more rapid refresh than what is available from the previous GOES West satellite.
GOES-17 moved into operational service as GOES West on February 12, 2019. GOES-15 continued to operate in tandem with GOES-17, as a precaution, while engineers worked on technical issues with the loop heat pipes, until NOAA powered off GOES-15 and placed it into orbital storage on March 2, 2020. NOAA returned the GOES-15 imager to temporary service in 2020 and 2021 to supplement GOES-17 observations during the “warm” periods that degraded some GOES-17 imagery during the during the peak period for Eastern Pacific tropical cyclones. GOES-18, launched on March 1 2022, provided operational ABI data during GOES-17 warm periods, beginning in August 2022.GOES-18 replaced GOES-17 as the operational GOES West satellite on January 4, 2023. GOES-17 was moved to 105 degrees west longitude on January 12, 2023, and now serves as a backup to the operational GOES constellation.
Latest Status
February 7, 2022
GOES-17 ABI saturation prediction reference tools for 2022 are now available.
Previous Status Updates
Show/Hide (below) all status updates on the GOES-17 ABI cooling system issue.
Estimated Channel Availability
Below is the current assessment of channel availability, as of Feb. 10, 2022.
Note: This is a preliminary estimate that is subject to change as experts refine channel availability.
| COLOR KEY: | Available 24hrs/day | Availability Exceptions |
Tables scroll horizontally on smaller windows and devices.
| Band | Channel | Function | Estimated Unsaturated Signal Cold Season (Solstice) | Estimated Unsaturated Signal Warm Season (Pre-Eclipse) |
|---|---|---|---|---|
| 1 | 0.47 µm | Blue | 24 hr | 24 hr |
| 2 | 0.64 µm | Red | 24 hr | 24 hr |
| 3 | 0.86 µm | Veggie | 24 hr | 24 hr |
| 4 | 1.38 µm | Cirrus | 24 hr | 24 hr |
| 5 | 1.61 µm | Snow/Ice | 24 hr | 24 hr |
| 6 | 2.25 µm | Cloud Particle Size | 24 hr | 24 hr |
| 7 | 3.90 µm | Shortwave Window | 24 hr | 24 hr |
| 8 | 6.18 µm | Upper-Level Water Vapor | 24 hr | 16 - 17 hr |
| 9 | 6.95 µm | Mid-Level Water Vapor | 24 hr | 19 - 20 hr |
| 10 | 7.34 µm | Lower-Level Water Vapor | 24 hr | 16 - 17 hr |
| 11 | 8.50 µm | Cloud-Top Phase | 24 hr | 20 - 21 hr |
| 12 | 9.61 µm | Ozone | 24 hr | 16 - 17 hr |
| 13 | 10.35 µm | Clean IR Longwave Window | 24 hr | 22-23 hr |
| 14 | 11.20 µm | IR Longwave Window | 24 hr | 21 - 22 hr |
| 15 | 12.30 µm | Dirty Longwave Window | 24 hr | 20 - 21 hr |
| 16 | 13.30 µm | CO2 Longwave Infrared | 24 hr | 16 - 17 hr |
The following serves to provide users with more information on when to expect degraded imagery due to saturated channels because of the loop heat pipe anomaly on GOES-17. PLEASE NOTE: This information is an estimation, subject to change over time as instrument performance is better understood. This information reflects operational status as of Feb. 7, 2022.
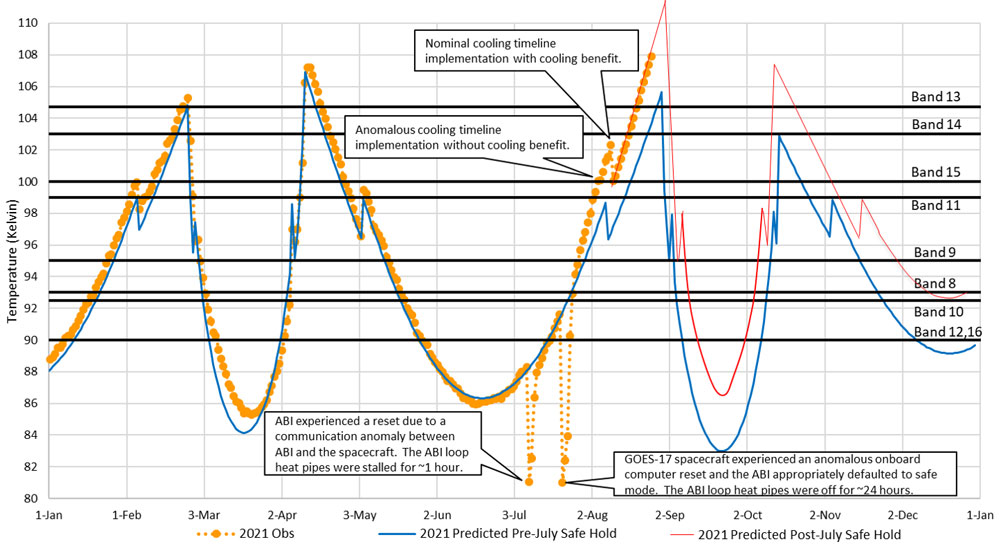
GOES-17 Predicted Peak Longwave Focal Plane Temperature (2022)
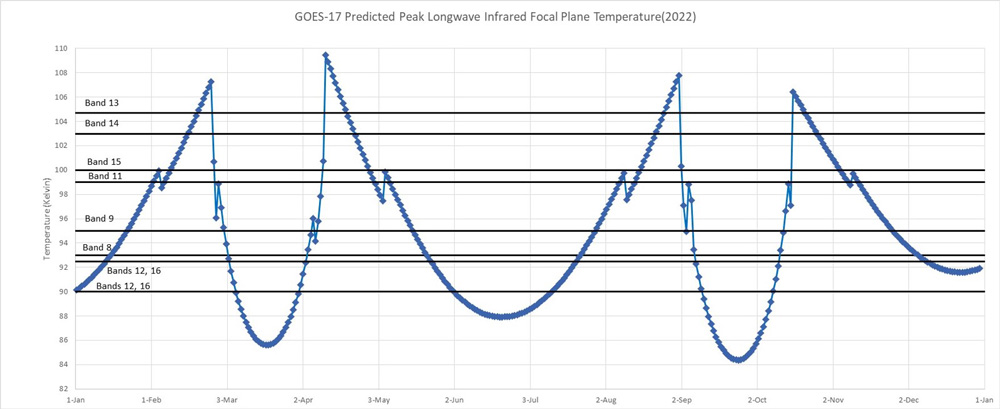
During the periods where the temperature is rising and falling, imagery can be considered marginally usable meaning there is some degradation to the imagery such as striping and increased noise, but the imagery is sufficiently good to be used qualitatively.
During the peak operating temperatures, imagery can be considered unusable meaning the imagery provides no value for interpretation.
Around the spring and fall equinox each year, GOES-17 will perform a yaw flip maneuver. This is done to ensure the maximum amount of sunlight does not penetrate the most sensitive part of the ABI. This maneuver is necessary to keep channel saturation down to the lowest amounts possible. The yaw flips can be seen on the graph above where the line disconnects briefly in late March and late September.
The table below explains the figure above and provides the approximate time frame each day of channel saturation and the channels affected. PLEASE NOTE: This information is an estimation, subject to change over time as instrument performance is better understood.
2022 ABI Channel Saturation Predictions |
|||||
|---|---|---|---|---|---|
| Date Range | Characterization of Daily Maximum Values | Characterization of Diurnal Values | |||
| All Periods | For impacted days, channel saturation begins each day with impacts to bands in this chronological order: 12, 16, 10, 8, 9, 11, 15, 14, 13 | Peak saturation occurs at approximately 1300-1330 UTC. | |||
| Jan 1-Feb 25 | Channel impacts begin as marginal and end as unusable from the beginning to the end of time period with a slight cooling correction when the cooling timeline is turned on. | Saturation may occur between approximately 1000-1730 UTC. Peak saturation occurs at the end of the time period. | |||
| 25 Feb-20 Mar | Channel impacts begin as unusable and end as marginal from the beginning to the end of the time period with a slight warming correction when the cooling timeline is turned off. | Saturation may occur between approximately 1000-1730 UTC. Peak saturation occurs at the beginning of the time period. | |||
| 20 Mar | Spring Equinox | ||||
| 20 Mar-13 Apr | Channel impacts begin as marginal and end as unusable from the beginning to the end of time period with a slight cooling correction when the cooling timeline is turned on. | Saturation may occur between approximately 1030-1630 UTC. Peak saturation occurs at the end of the time period. | |||
| 13 Apr-Jun 22 | Channel impacts begin as unusable and end as marginal from the beginning to the end of the time period with a slight warming correction when the cooling timeline is turned off. | Saturation may occur between approximately 1030-1630 UTC. Peak saturation occurs at the beginning of the time period. | |||
| 21 Jun | Summer Solstice | ||||
| Jun 22-Sep 1 | Channel impacts begin as marginal and end as unusable from the beginning to the end of time period with a slight cooling correction when the cooling timeline is turned on. | Saturation may occur between approximately 1030-1630 UTC. Peak saturation occurs at the end of the time period. | |||
| 1 Sep-24 Sep | Channel impacts begin as unusable and end as marginal from the beginning to the end of the time period with a slight warming correction when the cooling timeline is turned off. | Saturation can occur between approximately 1030-1630 UTC. Peak saturation occurs at the beginning of the time period. | |||
| 22 Sep | Fall Equinox | ||||
| 24 Sep-17 Oct | Channel impacts begin as marginal and end as unusable from the beginning to the end of time period with a slight cooling correction when the cooling timeline is turned on. | Saturation can occur between approximately 0930 1700 UTC. Peak saturation occurs at the end of the time period. | |||
| 17 Oct-31 Dec | Channel impacts begin as unusable and end as marginal from the beginning to the end of the time period with a slight warming correction when the cooling timeline is turned off. | Saturation can occur between 0930-1700 UTC. Peak saturation occurs at the beginning of the time period. | |||
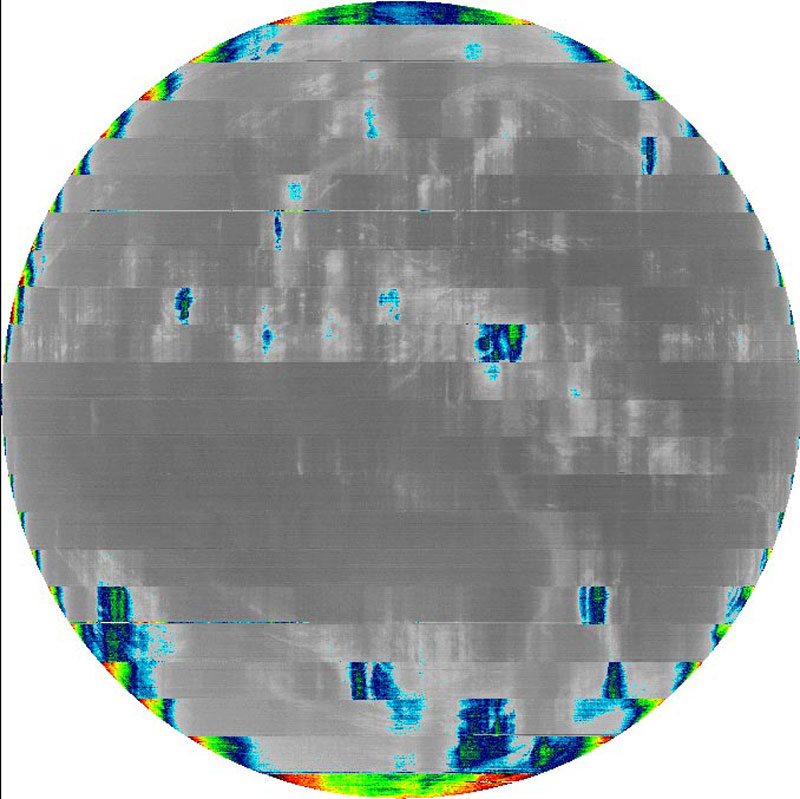
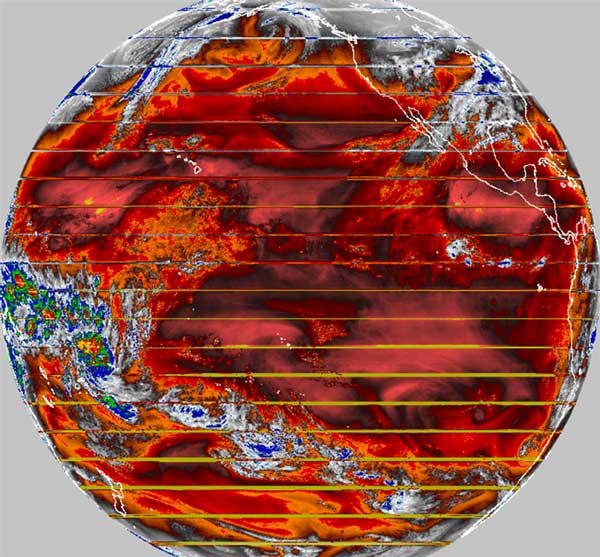
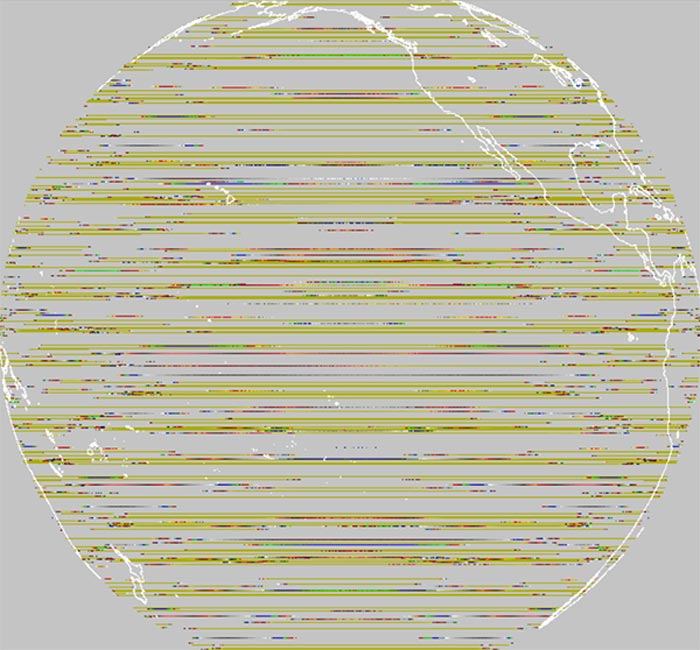
Examples of Degraded Imagery:
Impact to Data Products
Many of the ABI Level 2 data products are affected to some degree, such as weather products showing cloud height and temperature, volcanic ash, derived motion winds, etc. since many of them use the longwave IR channels. A summary of data products and ABI band input follows. The Science Options Team is evaluating derived products based on channel availability and data quality in order to maximize mission effectiveness.
Tables scroll horizontally on smaller windows and devices.
| Wavelength (Micrometers) | 0.47 | 0.64 | 0.865 | 1.378 | 1.61 | 2.25 | 3.9 | 6.185 | 6.95 | 7.34 | 8.5 | 9.61 | 10.35 | 11.2 | 12.3 | 13.3 | |
|---|---|---|---|---|---|---|---|---|---|---|---|---|---|---|---|---|---|
| Channel ID | 1 | 2 | 3 | 4 | 5 | 6 | 7 | 8 | 9 | 10 | 11 | 12 | 13 | 14 | 15 | 16 | |
| Baseline Products | Lev 1 Reqmts Doc Priority | ||||||||||||||||
| Cloud & Moisture Imagery | 1 (KPP) | X | X | X | X | X | X | X | X | X | X | X | X | X | X | X | X |
| Aerosol Detection | 1 | X | X | X | X | X | X | X | X | X | |||||||
| Aerosol Optical Depth | 1 | X | X | X | X | X | X | ||||||||||
| Clear Sky Mask | 1 | X | X | X | X | X | X | X | X | X | X | ||||||
| Cloud Optical Depth | 1 | X | X | X | X | X | |||||||||||
| Cloud Particle Size Dist. | 1 | X | X | X | X | X | |||||||||||
| Cloud Top Phase | 1 | X | X | X | X | ||||||||||||
| Cloud Top Height | 1 | X | X | X | |||||||||||||
| Cloud Top Pressure | 1 | X | X | X | |||||||||||||
| Cloud Top Temperature | 1 | X | X | X | |||||||||||||
| Legacy Vertical Moisture Profile | 1 | X | X | X | X | X | X | X | X | X | |||||||
| Legacy Vertical Temp Profile | 1 | X | X | X | X | X | X | X | X | X | |||||||
| Total Precipitable Water | 1 | X | X | X | X | X | X | X | X | X | |||||||
| Derived Motion Winds | 1 | X | X | X | X | X | X | ||||||||||
| Radiances | 1 | X | X | X | X | X | X | X | X | X | X | X | X | X | X | X | X |
| Rainfall Rate/QPE | 2 | X | X | X | X | X | |||||||||||
| Derived Stability Indices | 2 | X | X | X | X | X | X | X | X | X | |||||||
| Downward Solar Insolation Surf | 2 | X | X | X | X | X | |||||||||||
| Reflected Solar Insolation TOA | 2 | X | X | X | X | X | |||||||||||
| Fire Hot Spot Characterization | 2 | X | X | X | X | ||||||||||||
| Land Surface Temperature | 2 | X | X | ||||||||||||||
| Snow Cover | 2 | X | X | X | X | X | X | X | |||||||||
| Sea Surface Temperature | 2 | X | X | X | X | X |
| Wavelength (Micrometers) | 0.47 | 0.64 | 0.865 | 1.378 | 1.61 | 2.25 | 3.9 | 6.185 | 6.95 | 7.34 | 8.5 | 9.61 | 10.35 | 11.2 | 12.3 | 13.3 | |
|---|---|---|---|---|---|---|---|---|---|---|---|---|---|---|---|---|---|
| Channel ID | 1 | 2 | 3 | 4 | 5 | 6 | 7 | 8 | 9 | 10 | 11 | 12 | 13 | 14 | 15 | 16 | |
| Baseline Products | Lev 1 Reqmts Doc Priority | ||||||||||||||||
| Fog & Low Stratus | 3 | X | X | X | X | X | X | X | X | ||||||||
| Aerosol Particle Size | 3 | X | X | X | X | X | |||||||||||
| Cloud Cover Layer Heights | 3 | X | X | X | |||||||||||||
| Sea and Lake Ice (concentration, age/thickness, motion) | 4 | X | X | X | X | X | |||||||||||
| ASOS Cloud Product | GOES-NOP continuity | X | X | X |
| Wavelength (Micrometers) | 0.47 | 0.64 | 0.865 | 1.378 | 1.61 | 2.25 | 3.9 | 6.185 | 6.95 | 7.34 | 8.5 | 9.61 | 10.35 | 11.2 | 12.3 | 13.3 | |
|---|---|---|---|---|---|---|---|---|---|---|---|---|---|---|---|---|---|
| Channel ID | 1 | 2 | 3 | 4 | 5 | 6 | 7 | 8 | 9 | 10 | 11 | 12 | 13 | 14 | 15 | 16 | |
| Baseline Products | Lev 1 Reqmts Doc Priority | ||||||||||||||||
| Day Cloud Phase Distinction | AWIPS | X | X | X | |||||||||||||
| Nighttime Microphysics | AWIPS | X | X | X | |||||||||||||
| Day Land Cloud | AWIPS | X | X | X | |||||||||||||
| Day Convection | AWIPS | X | X | X | X | X | X | ||||||||||
| Day Cloud Convection | AWIPS | X | X | ||||||||||||||
| Day Ocean Cloud Convection | AWIPS | X | X | ||||||||||||||
| Fire Temperature | AWIPS | X | X | X | |||||||||||||
| Day Land Cloud Fires | AWIPS | X | X | X | |||||||||||||
| Simple Water Vapor | AWIPS | X | X | X | |||||||||||||
| Differential Water Vapor | AWIPS | X | X | ||||||||||||||
| Air Mass | AWIPS | X | X | X | X | ||||||||||||
| Ash | AWIPS | X | X | X | X | ||||||||||||
| Dust | AWIPS | X | X | X | X | ||||||||||||
| Day Snow-Fog | AWIPS | X | X | X | X | ||||||||||||
| CIMSS Natural Color | AWIPS | X | X | X | |||||||||||||
| SO2 | AWIPS | X | X | X | X | ||||||||||||
| Daytime Composite #1 | AWIPS | X | X | X | |||||||||||||
| Daytime Composite #5 | AWIPS | X | X | ||||||||||||||
| Cloud Type RGB | AWIPS | X | X | X |
Path Forward
The GOES-17 Advanced Baseline Imager cooling system anomaly Independent Review Team recommended changes to the design of the ABI radiator/loop heat pipes for GOES-T and GOES-U to decrease the chance of future cooling system anomalies. The new design utilizes a simpler hardware configuration and ammonia loop heat pipes instead of propylene. Due to this redesign, the planned launch of GOES-T in mid-2020 was delayed. GOES-T launched on March 1, 2022, and was renamed GOES-18 when it reached geostationary orbit. The GOES-U launch date remains 2024.
GOES-17 moved into operational service as GOES West on February 12, 2019. NOAA plans to place GOES-18 into operational service as GOES-West, replacing GOES-17, in early 2023.
Data Flow to Users
The GOES-17 ABI Level 1b (L1b) and cloud and moisture imagery (CMI) data was declared “Beta” validated on August 27, 2018, following the beta Maturity Peer Stakeholder – Product Validation Review. The data was released through GOES Rebroadcast (GRB) on August 28, 2018.
The ABI L1b and CMI data products are calibrated and geo-located radiances of the 16 ABI bands over the full disk (FD) of the Earth, the continental United States (CONUS) region, the mesoscale (MESO) regions, and certain instrument calibration and engineer data. Beta maturity is defined by the following:
- Initial calibration applied (L1b);
- Rapid changes in product input tables / algorithms can be expected;
- Product quick looks and initial comparisons with ground truth data not adequate to determine product quality;
- Anomalies may be found in the product and the resolution strategy may not exist;
- Product is made available to users to gain familiarity with data formats and parameters (via GRB);
- Product has been minimally validated and may still contain significant errors; and
- Product is not optimized for operational use.
Beta users bear all responsibility for inspecting the data prior to use and for the manner in which the data are utilized. Persons desiring to use the GOES-17 ABI beta maturity L1b products for any reason, including but not limited to scientific and technical investigations, are encouraged to consult the NOAA ABI calibration scientists for feasibility of the planned applications.
Known issues being investigated include the following:
- An anomaly with the ABI loop heat pipe (LHP) prevents the instrument cooling system from maintaining sufficiently cool temperatures during certain parts of the day and year. Data quality will fluctuate seasonally depending on the amount of solar radiation absorbed by the instrument. During the instrument’s “cool” seasons (near the summer and winter solstice), all channels are expected to be nominal 24 hours per day. During the instrument’s “warm” seasons (before and after the vernal and autumnal equinox), experts estimate 7 channels (bands 1-7) will be of nominal quality 24 hours per day and the other 9 channels (bands 8-16) will be degraded and images will be of reduced quality or unusable 2-6 hours per night. These estimates are preliminary and are still being refined. The warmest part of the season is coming up in early September and performance estimates will need to be confirmed through observation during that time.
- Significant stray light exists for VNIR channels approximately one hour before and after satellite local midnight for approximately forty days during the eclipse season before the vernal (spring) equinox and after the autumnal (fall) equinox, and may exist in other days of the year.
- Stray light exists for band 7 approximately one hour before and after satellite local midnight for approximately forty days during the eclipse season before the vernal (spring) equinox and after the autumnal (fall) equinox. The intensity of the stray light is less than the requirements, but may affect certain applications.
- Band 1 radiances may be brighter on the west end than on the east end by 1% or more.
- Band 4 radiances are about 7% darker, and band 5 radiances are about 7% brighter than commonly accepted values from comparable satellites products. These may be due to error in the gains of these channels so the bias is larger for brighter scenes.
- Band 2 is brighter than commonly accepted values by up to 10%.
- There are periodic infrared calibration anomalies (PICA) present in the data that can be seen as regular and repeating pulses in infrared brightness temperatures. The infrared calibration may produce an error with a periodicity depending on timeline.
- There are periodic infrared calibration anomalies (PICA) present in the data that can be seen as regular and repeating pulses in infrared brightness temperatures. The infrared calibration may produce an error with a periodicity depending on timeline.
- Image striping may occur across all 16 channels.
Contacts for specific information on the ABI data:
Fred Wu (L1b) xiangqian.wu@noaa.gov
Tim Schmit (CMI) tim.j.schmit@noaa.gov
There will be occasional interruptions to the flow while various post-launch tests occur and those interruptions will be communicated through the GRB forum distribution list.
A notification will be sent when the data is considered provisionally mature and suitable for operational use after further testing and validation.
Contact information for further information: NOAA Office of Satellite and Product Operations (OSPO) User Services at SPSD.UserServices@noaa.gov
See the OSPO General Satellite Messages webpage for this and other satellite related messages.
DATA QUALITY FLAGS
The GOES-17 ABI Level 1b (L1b) and Cloud and Moisture Imagery (CMI) achieved Provisional product maturity on November 28, 2018. All of the GOES-17 ABI L1b products, including channels degraded by the ABI cooling system anomaly, are being distributed via GOES Rebroadcast (GRB), Product Distribution and Access (PDA), and the Comprehensive Large Array-data Stewardship System (CLASS). Since ABI channels 8-16 could be degraded during parts of the day, the pixels that are impacted will be flagged during the data quality control (QC) check. The Data Quality Flags (DQF) are added to the metadata during product generation processing in the ground system and included in the L1b radiance and L2 CMI products. As of April 8, 2019, the DQF processing was updated to include a fifth state and some new variables. The DQF values are as follows:
DQF value 0 represents a pixel that passed the QC check and is labeled: good_pixel_qf
DQF value 1 represents a pixel that conditionally passed the QC check because it has some usable data and it is labeled: conditionally_usable_pixel_qf
DQF value 2 represents a pixel that failed the QC check because the pixel’s values are out of range and it is labeled: out_of_range_pixel_qf
DQF value 3 represents a pixel that had no values probably because the data was missing and it is labeled: no_value_pixel_qf
DQF value 4 (new) represents a pixel that was produced when the associated focal plane temperature exceeded a threshold and it is labeled: focal_plane_temperature_threshold_exceeded_qf
The metadata in the ABI Level 1b radiances product provides statistical and other properties of the product image and supports diagnosis of algorithm anomalies. Specific metadata includes:
- Number and percentage of good and conditionally usable, as well as missing pixels.
- Number and percentage of saturated and undersaturated pixels.
- New variable: Number of pixels where the focal plane temperature threshold was exceeded.
- focal_plane_temperature_threshold_exceeded_count (can treat as boolean)
- New variable: The percentages of pixels assigned to each DQF value.
- percent_focal_plane_temperature_threshold_exceeded_qf (new DQF attribute)
- New variable: Temperature threshold configuration, unique per band.
- focal_plane_temperature_threshold_increasing
- focal_plane_temperature_threshold_decreasing
- New variable: Peak focal plane temperature during the scene.
- maximum_focal_plane_temperature
The below table lists the initial thresholds for each band. When the threshold is exceeded on the warming side (focal_plane_temperature_threshold_increasing) the DQF value 4 is triggered (focal_plane_temperature_threshold_exceeded_qf). When the detectors are cooling and fall below the threshold on the cooling side (focal_plane_temperature_threshold_decreasing), DQF value 4 will no longer be utilized. These thresholds are configurable and the table below describes what was initially put into place with the new DQF=4 change.
GOES-17 ABI temperature data quality flag thresholds as of April 8, 2022.
| Band # | Approx. Central Wavelength (um) | Warming Side (K) | Cooling Side (K) |
|---|---|---|---|
| 7 | 3.9 | 150 | 150 |
| 8 | 6.2 | 93.0 | 94.0 |
| 9 | 7.0 | 94.0 | 94.0 |
| 10 | 7.3 | 91.0 | 91.5 |
| 11 | 8.4 | 97.0 | 98.0 |
| 12 | 9.6 | 89.0 | 90.0 |
| 13 | 10.3 | 104.0 | 101.0 |
| 14 | 11.2 | 104.0 | 94.0 |
| 15 | 12.3 | 93.0 | 94.0 |
| 16 | 13.3 | 86.0 | 87.0 |
The reference for these flags is the GOES-R Product Definition and Users’ Guide (PUG) Volume 4.
Frequently Asked Questions
What exactly is wrong with the cooling system?
The ABI cooling system is necessary to keep the instrument’s components at proper operating temperatures. The ABI infrared detectors need to be very cold so that they can accurately measure the thermal energy being radiated from the Earth’s atmosphere. The detectors need to be cooled to varying degrees (some as low as -351℉) based on where they fall on the electromagnetic spectrum to function properly.
The ABI utilizes several assemblies and subsystems to maintain thermal control of the instrument. There is a mechanical cooler that pumps heat away from the visible and infrared detectors to cool them to their required temperatures. The heat from this cryocooler and the instrument electronics are transported to an external radiator by the loop heat pipes. The radiator is a large reflective surface that is designed to reject excess thermal energy to space. Other components of the thermal system are blankets and shields that that protect the instrument from absorbing too much solar radiation.
The loop heat pipes are not properly transferring excess thermal energy to the radiator, resulting in overheating of the cryocooler and other electronics. Inadequate cooling of the infrared channels leads to partial loss of imagery during some of the overnight hours before and after the vernal and autumnal equinoxes.
What is the root cause of the anomaly?
The Independent Review Team (IRT) chartered to investigate the issue concluded that the most likely cause of the thermal performance issue is foreign object debris (FOD) blocking the flow of the coolant in the loop heat pipes. A series of ground-based tests supported FOD as the most likely cause. A second potential cause, mechanical failure, was investigated and deemed unlikely.
Will this issue affect GOES-17 going into operational service?
Experts have recovered a great deal of the instrument’s capability. The ABI operations have been optimized to produce the best possible performance in spite of the loop heat pipe anomaly. Changes have been made to the instrument thermal set points, operating modes, calibration techniques, ground system processing algorithms, and software to improve availability of the infrared channels. GOES-17 was designated NOAA’s GOES West operational satellite on February 12, 2019. We are confident GOES-17 will continue to meet the needs of the National Weather Service and forecasters around the nation.
How is GOES-17’s performance compared to the current GOES West satellite, GOES-15?
GOES-17 is observing with more channels, at higher resolution, and with more rapid refresh than GOES-15. GOES-17 also includes the Geostationary Lightning Mapper, and four instruments for improved solar and space weather monitoring and forecasting. While the GOES-17 imager will not produce the full set of planned data, we are receiving more and better data than we previously had. We are confident we will be able to continue to meet the operational needs of the National Weather Service.
Is there an issue with the GOES-16 ABI or Himawari imager loop heat pipes?
Since first learning of the cooling system issue with GOES-17, the Independent Review Team has reviewed GOES East (GOES-16) data and the analysis shows there is evidence of some reduced functionality from these loop heat pipes as well, which the investigation team believes is related to the GOES-17 issue. Despite the noted change, the current GOES-16 LHP performance is sufficient for full ABI operation and the overall orbital trend does not indicate progressive degradation. At this time, NOAA does not anticipate any impact to the GOES-16 operational satellite.
Review of the Himawari-8 and -9 data does not generally show the phenomena that are observed in the GOES-16 and GOES-17 ABI data.
What does this mean for the GOES-T and GOES-U ABIs and launch schedule?
The GOES-17 Advanced Baseline Imager cooling system anomaly Independent Review Team recommended changes to the design of the ABI radiator/loop heat pipes for GOES-T and GOES-U to decrease the chance of future cooling system anomalies. The new design utilizes a simpler hardware configuration that eliminates the filters that are susceptible to debris. Due to this redesign, the planned launch of GOES-T in mid-2020 was delayed. GOES-T launched on March 1, 2022. The issue does not affect GOES-U’s planned launch date in 2024.
How will this issue affect the National Weather Service’s ability to forecast weather conditions?
GOES-17 is providing more and better data than what was available from GOES-15 (the previous GOES West satellite). Degraded imagery will be limited to 7 of the imager’s 16 channels, for 3-6 hours overnight, before and after the vernal and autumnal equinox. The ABI will provide more than 97% of the data it was designed to provide. We are confident we will continue to meet the operational needs of the National Weather Service.