- Basics/Related Info
- GOES-R 101
- GOES-R: Benefits of Next-Generation Environmental Monitoring
- GOES-R Fact Sheets
- Training By Subject
- Aerosols/Air Quality/Atmospheric Composition
- Aviation
- Climate
- Clouds
- Convection
- Fire
- General Satellite Meteorology
- Hydrology
- Imagery
- Instruments
- Lightning
- Space Weather
- Winds
- By Institute


SPoRT Training Resources
Click on the thumbnail images or links below to launch/redirect to each training course.
NASA’s Short-term Prediction Research and Transition Center (SPoRT)
![]() NASA’s Short-term Prediction Research and Transition Center (SPoRT) provides training about specific products, discussing the strengths and weaknesses, with the goal of successfully transitioning products to operations. This training is built from surveys and direct communication with our partners. With this paradigm, the forecasters are an integral component of the transition process and not a passive recipient of data.
NASA’s Short-term Prediction Research and Transition Center (SPoRT) provides training about specific products, discussing the strengths and weaknesses, with the goal of successfully transitioning products to operations. This training is built from surveys and direct communication with our partners. With this paradigm, the forecasters are an integral component of the transition process and not a passive recipient of data.
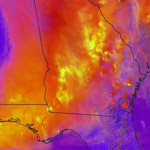
Air Mass RGB
Air Mass RGB: This micro-lesson is focused on an application of the Air Mass RGB to anticipate rapid cyclogenesis and high impact winds. The case presented is the development of a storm force low in the Western Atlantic and the use of the RGB to anticipate changes in cyclone intensity and associated impacts such as high wind. Basic interpretation and description of the R-G-B components are presented.
Ash RGB
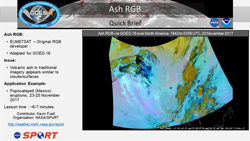
Ash RGB: This micro-lesson demonstrates the value of the Ash RGB for an eruption event near Mexico City. The ash from the Popocatepetl volcano is more easily seen via the combination of infrared channels into an RGB imagery product verses a single channel or channel difference. The RGB adds value by better differentiating ash from other cloud or surface features. The RGB components are explained and a basic interpretation of the resulting colors within the image is provided.
Aviation Forecasting RGB Products
Aviation Forecasting RGB Products: This eight-minute micro-lesson reviews some specific utilities of the nighttime microphysics RGB, the hybrid LEO/GEO fog and low cloud product, and the VIIRS day-night band RGB relative to aviation weather forecasting. Included are a review of each of the products, as well as examples on their use individually and in tandem to help improve fog and low cloud forecasting for terminal aerodome forecasts (TAFs) and other aviation requirements.
Day Convection RGB
Day Convection RGB: Originally developed by EUMETSAT and referred to as the Severe Storms RGB, this product was renamed and adapted for GOES ABI. Convection can be seen in several of the single channels from ABI, but it is severe convection from very strong updrafts that is the focus of this RGB. Examples from ABI during the spring of 2018 are presented over the CONUS as well as marine regions. The objective of this lesson is to apply the Day Convection RGB to identify where strong updrafts are occurring and associated severe convection is likely to result in hazards such as large hail, severe wind, and heavy precipitation.
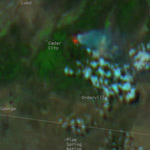
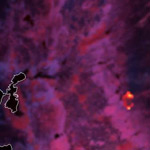
Day Land Cloud Fire RGB
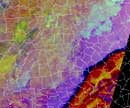
Day Land Cloud Fire RGB: The focus of this micro-lesson is on the Natural Color Fire RGB product. This RGB is similar to the Day Land Cloud or Natural Color RGB; however, one of the channels is replaced to specifically focus on fire hot spots. The RGB allows one to view the smoke and fire hot spots within the same product. The case used for this object is the October 2017 Northern California Firestorm. The objective for this item is to have the forecaster demonstrate the ability to identify various hot spots within the Day Land Cloud Fire RGB imagery.
Dust RGB
Dust RGB: This micro-lesson demonstrates the value of applying Dust RGB imagery from the GOES-R ABI via an event from March 2017 in the U.S. Southwest. The Dust RGB is compared to traditional visible and infrared single-channel imagery to show the operational value of the multi-channel RGB imagery for analyzing blowing dust plumes during both day and night.
Dust RGB identifies aviation ceiling hazard at KFMN
Dust RGB identifies aviation ceiling hazard at KFMN: This seven-minute micro-lesson of the dust RGB application to a mesoscale event that impacted the ceiling conditions at the Farmington, New Mexico airport (i.e. TAF site). Observations at the site and the changes to the TAF are highlighted. The lesson also illustrates the value of the dust RGB with the GOES visible and MODIS/VIIRS true color imagery.
Fire Temperature RGB
Fire Temperature RGB: This micro-lesson illustrates the application of the Fire Temperature RGB developed originally using the VIIRS imager on Suomi-NPP and translated for use with the GOES-16/17 ABI. This RGB takes advantage of the difference in saturation of several short-wave infrared channels when sensing wildfires. Traditional “hotspots” via short-wave infrared imagery is compared to the RGB imagery which provides an intensity estimate based on the saturation level of the individual channels.
GLM Applications Overview
GLM Applications Overview: This micro-lesson for the Geostationary Lightning Mapper (GLM) provides an initial introduction to the utility of the flash extent density product that shows the number of flashes per grid box per minute. Three main applications are discussed that include physical reasoning behind GLM observations, using flash extent for decision support, and applying the product for lightning safety.
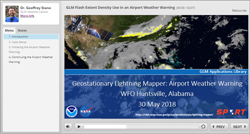
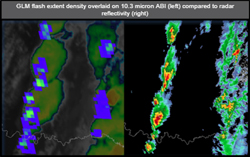
GLM Flash Extent Density use in an Airport Weather Warning
GLM Flash Extent Density use in an Airport Weather Warning: This micro-lession highlights the use f the Geostationary Lightning Mapper (GLM) Flash Extent Density product during an operational use to produce an airport weather warning.
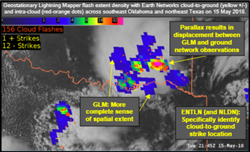
GLM and Ground Networks: Basics of Observations, Advantages, and Parallax
GLM and Ground Networks: Basics of Observations, Advantages, and Parallax: This micro-lesson discusses the Geostationary Lightning Mapper (GLM) with the available ground networks to detect lightning. GLM detects total lightning and is visualized quite differently from the ground networks. This will be illustrated through several examples. The lesson includes a basic inter-comparison of the GLM and the ground networks, strengths of each respective system, and parallax of the GLM.
Lightning provides advanced lead time for tornado event
Lightning provides advanced lead time for tornado event: Total lightning trends provide a proxy to storm stage and a “jump” in activity can be a precursor to severe weather. This case demonstrates the application of total lightning source density (similar to ‘events’ from GLM) along with radar data to anticipate severe weather, which resulted in a tornado event.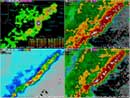
Lightning Operational Uses: Severe Weather
Lightning Operational Uses: Severe Weather: This is a follow-up to the Lightning Training: Part 1 module and assumes a basic knowledge of total lightning. This sub-section focuses on the most common use of total lightning; severe weather decision support. This module focuses on the use of lightning jumps for three different events. These include a severe wind and hail event as well as a tornadic event. The full module includes the safety and additional scenarios sub-sections.
Lightning Training: Part 1
Lightning Training: Part 1: This module introduces the user to total lightning and the source density product provided by NASA SPoRT.
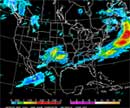
NESDIS GOES-R QPE
NESDIS GOES-R QPE (pdf): This short reference guide describes the NESDIS GOES-R quantitative precipitation estimation product suite in the context of operations. GOES-R QPE uses both infrared and microwave data to retrieve rainfall rates in both the GOES East and GOES West domains, and the mechanics of this algorithm are briefly described. The rainrate and accumulation products are shown in a number of operationally-based examples, demonstrating the uses of GOES-R QPE in different regions and environments.
Nighttime Microphysics RGB
Nighttime Microphysics RGB: This micro-lesson demonstrates the operational use of the Nighttime Microphysics RGB both to increase the lead time or to avoid a ‘false alarm’ of advisory products related to fog hazards. The RGB is compared to the traditional split window difference of the long and short-wave infrared channels for the identification of low clouds and fog. Other mid- and upper-level clouds are apparent in the RGB, but they are not the focus of this particular training.
Valley fog through mid/high clouds in Southern Appalachians
Valley fog through mid/high clouds in Southern Appalachians: This 8-minute micro-lesson demonstrates the value of multispectral (i.e. RGB imagery) to the analysis of fog and low clouds in valleys of the southern Appalachians, particularly compared to channel differencing.
WRF Model Lightning Forecast Algorithm (LFA)
WRF Model Lightning Forecast Algorithm (LFA): This tutorial provides background information on the development, calibration, and application of the lightning forecast algorithm (LFA), as implemented into the Weather Research and Forecasting (WRF) numerical weather prediction model. The LFA is a demonstration product for use in the GOES-R Proving Ground to develop model proxy fields of total lightning that could be used in future data assimilation applications of the Geostationary Lightning Mapper.