GOES-R Series News | 2019
-
December 19, 2019: Cloud Platforms Unleash Full Potential of NOAA’s Environmental Data
![NOAA’s Big Data Project]()
NOAA’s Big Data Project. NOAA’s vast collection of environmental data will be more accessible than ever before through new collaborations announced on December 19, 2019, with Amazon Web Services (AWS), Google Cloud, and Microsoft. Under these new agreements, commercial cloud platform providers will generate untold opportunities for scientific and economic advances by exponentially expanding, rapid and reliable, no-cost access to NOAA data for the public. NOAA has entered into separate multiyear contracts with AWS, Google Cloud, and Microsoft to provide the public with cloud-based access to the agency’s environmental data sets, in accordance with the agency’s full and open data policies. NOAA generates tens of terabytes of data every day from satellites, radars, ships, weather models, and other sources.
-
December 18, 2019: NASA Awards Launch Services Contract for GOES-T
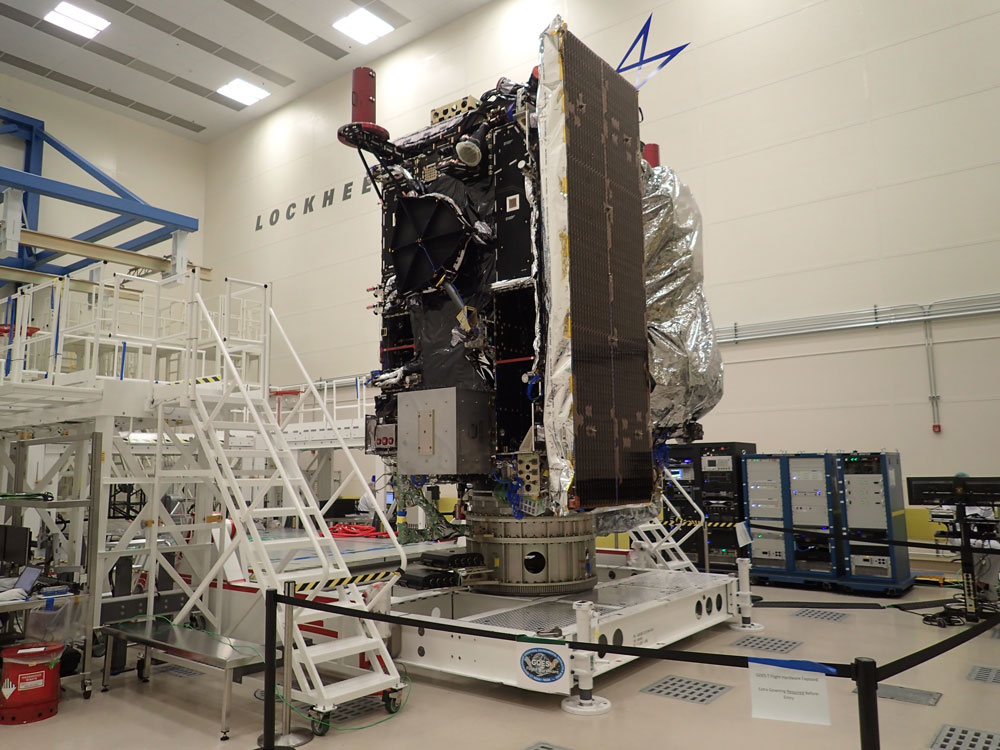
![GOES-T in a clean room at Lockheed Martin near Denver. Credit: Lockheed Martin]()
GOES-T in a clean room at Lockheed Martin near Denver. Credit: Lockheed Martin NASA has selected United Launch Services LLC (ULS) of Centennial, Colorado, to provide launch services for GOES-T, the third satellite in the GOES-R Series. GOES-T is currently targeted to launch in December 2021 on an Atlas V 541 rocket from Launch Complex 41 at Cape Canaveral Air Force Station in Florida. NASA’s Launch Services Program at NASA’s Kennedy Space Center in Florida will manage the ULS launch service. The GOES-R Flight Projects Office is managed by NASA's Goddard Space Flight Center in Greenbelt, Maryland. The GOES-R Program is managed by NOAA.
-
December 18, 2019: NOAA Readies GOES-15 and GOES-14 for Orbital Storage
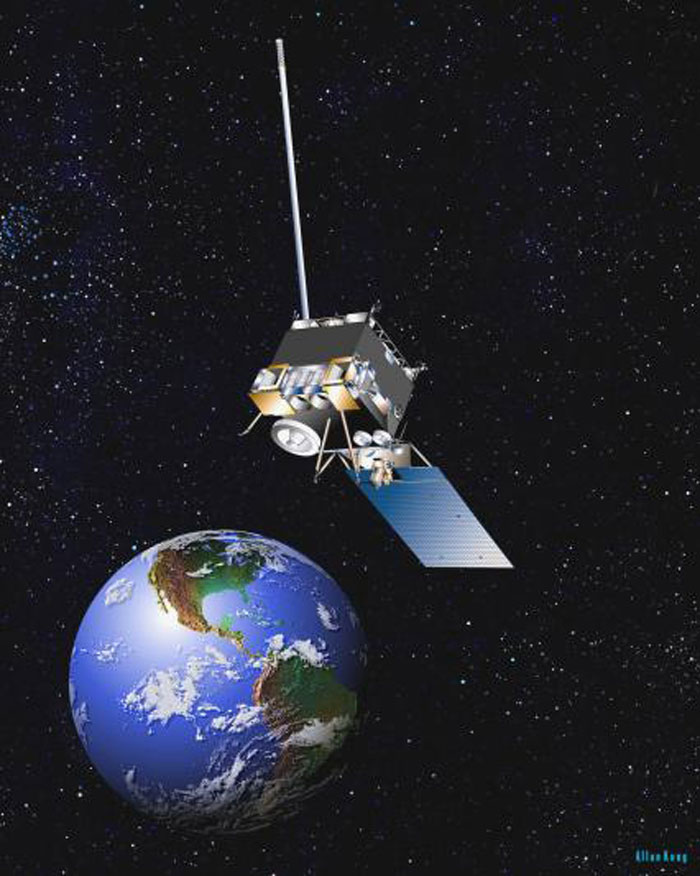
![Artist rendering of GOES-15 satellite in space. Credit: NOAA]()
Artist rendering of GOES-15 satellite in space. Credit: NOAA NOAA officials have announced plans to power off the GOES-15 satellite and place it into orbital storage by January 31, 2020. Since late 2018, GOES-15 has operated in tandem with its advanced, newly launched replacement, GOES-17, as a precaution, while engineers worked on technical issues with the loop heat pipe of the Advanced Baseline Imager (ABI), the primary instrument on the satellite. A blockage in the pipe prevented the ABI from cooling properly and hindered its ability to collect data during certain periods and hours of the year. Engineers mitigated the issue through operational changes to the ABI and mission operations, including the use of Artificial Intelligence techniques, to regain capability to collect data during a portion of the affected period. Those efforts have resulted in the GOES-17 ABI delivering more than 97 percent of expected data.
NOAA officials also announced GOES-14, which had been providing supplemental space weather instrument operations, will be powered off and placed in storage by January 31, 2020. GOES-16, perched in the GOES East orbit, is sending more advanced space weather data to NOAA's Space Weather Prediction Center. Additionally, GOES-17 is providing products in a developmental system for space weather. Having GOES-15 in storage allows GOES-17 to operate with sole coverage of the GOES West domain, able to see the weather, including storms, fog and wildfires, at high-resolution in the western U.S., Alaska and Hawaii and much of the Pacific Ocean. GOES-15 and GOES-14 can be called back into service if either GOES-17 or GOES-16 experience issues
-
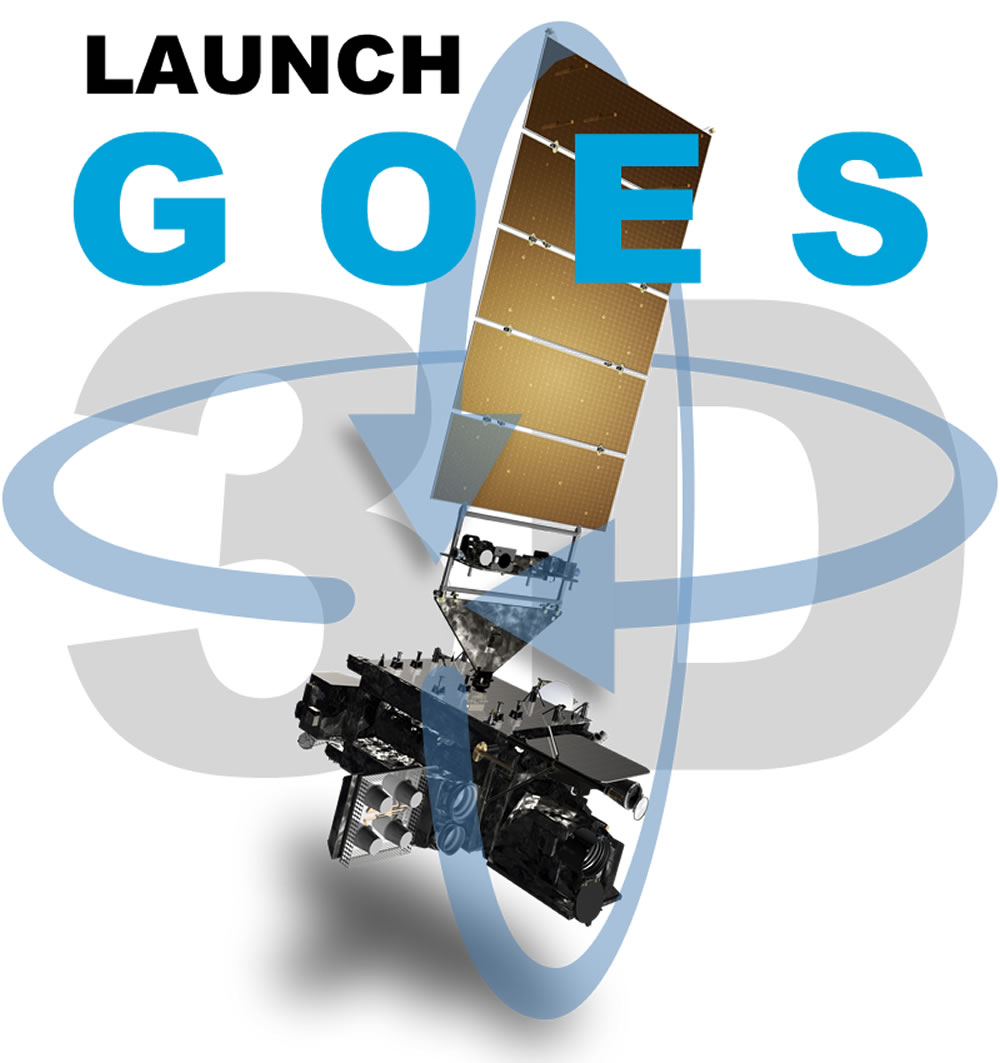
December 17, 2019: New! GOES-R 3D Model
![Explore a GOES-R Series satellite in this 3D model]()
Explore a GOES-R Series satellite in a new interactive model. Rotate the spacecraft, zoom in and out, and explore the components of the satellite. The mobile version has an augmented reality (AR) capability that allows you to superimpose the satellite on the scene in your device's camera!
-
December 9, 2019: GOES-16 Space Weather Data Now Operationally Available
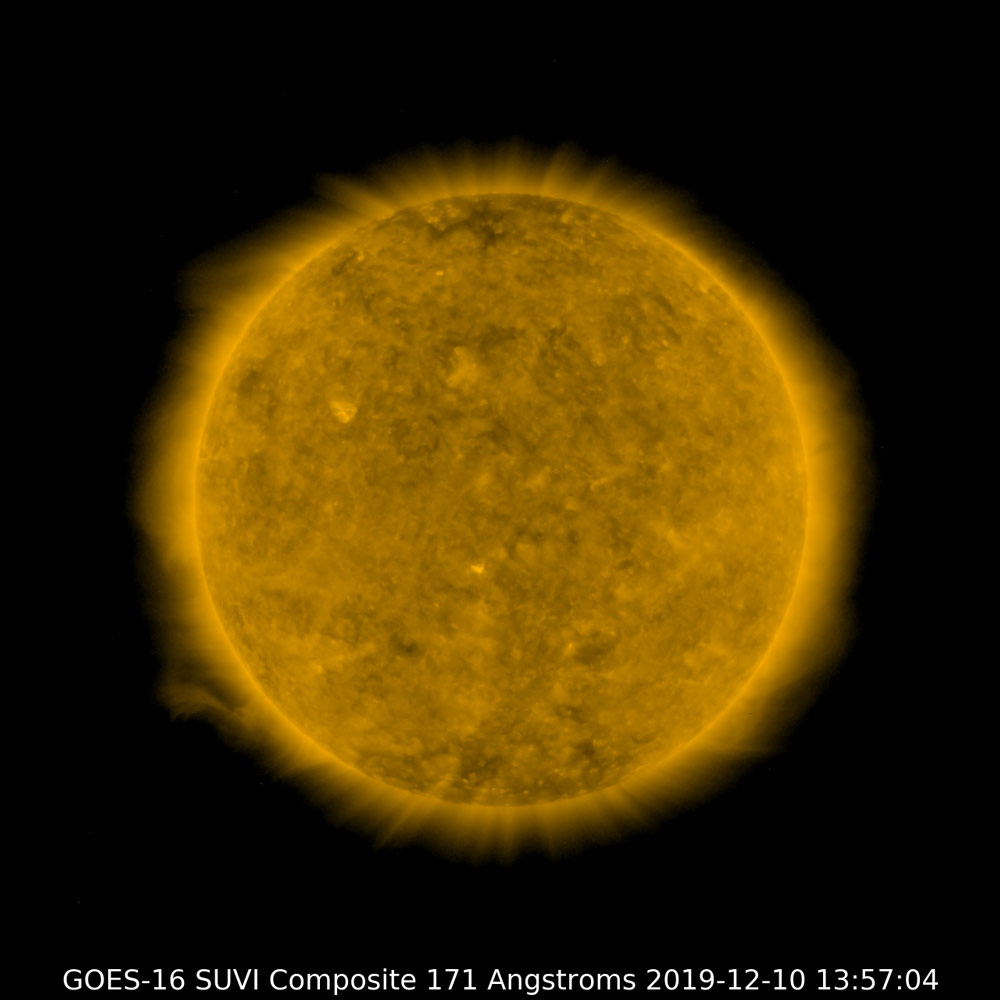
![GOES-16 SUVI image of the sun, December 10, 2019.]()
GOES-16 SUVI image of the sun, December 10, 2019. GOES-16 space weather data from the Solar Ultraviolet Imager (SUVI), Extreme Ultraviolet and X-ray Irradiance Sensors (EXIS), Space Environment In-Situ Suite (SEISS), and Magnetometer (MAG) instruments is now operationally available from NOAA’s Space Weather Prediction Center. GOES-16 is now the primary satellite for geostationary space weather observations. GOES-16 offers a number of improvements to space weather measurements.
-
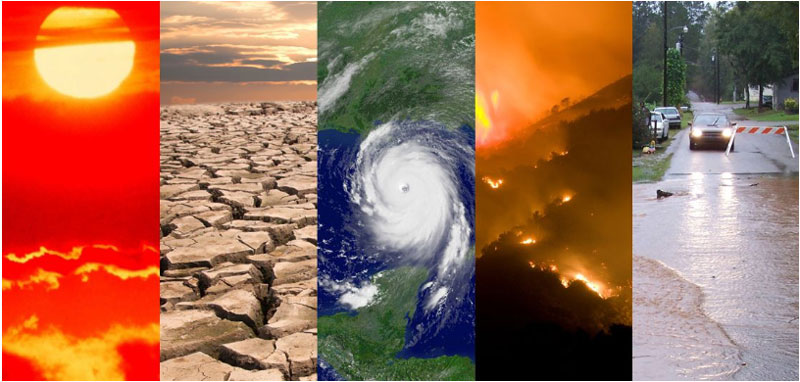
December 9, 2019: Report: Climate Change is Making Specific Weather Events More Extreme
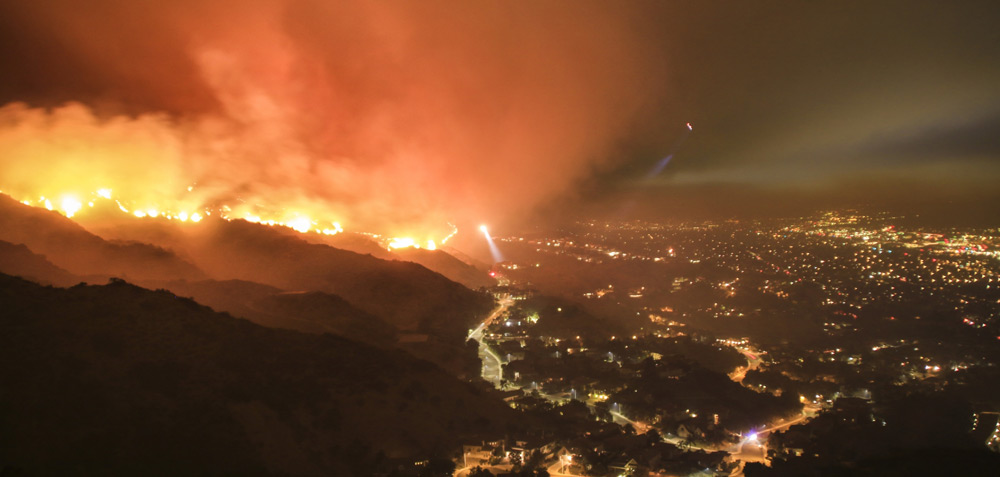
![2017 Wildfire in Los Angeles.]()
2017 Wildfire in Los Angeles. The Bulletin of the American Meteorological Society (BAMS) report, Explaining Extreme Events in 2018 from a Climate Perspective, presents 21 new peer-reviewed analyses of extreme weather across five continents and one sea during 2018. It features the research of 121 scientists from 13 countries looking at both historical observations and model simulations to determine whether and by how much climate change may have influenced particular extreme events. According to the report, the desiccating Four Corners drought, intense heat waves on the Iberian peninsula and in northeast Asia, exceptional precipitation in the Mid-Atlantic states, and record-low sea ice in the Bering Sea were 2018 extreme weather events made more likely by human-caused climate change.
-
December 3, 2019: Detecting Solar Features in Real Time
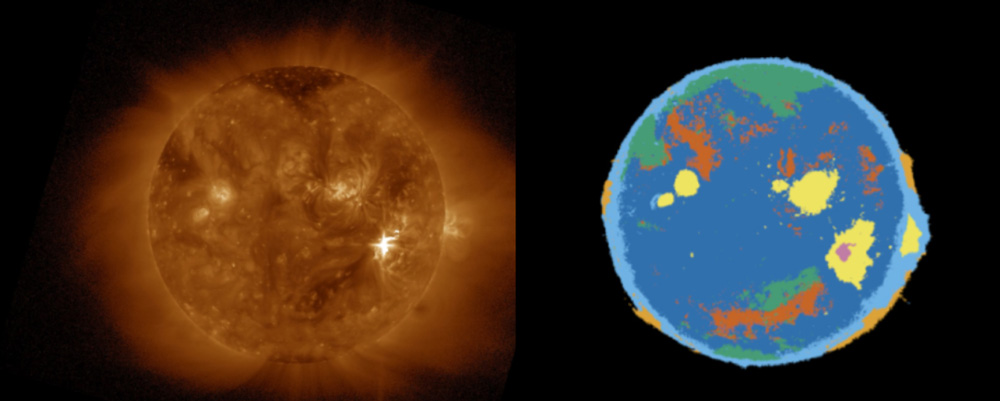
![The SUVI thematic map (right) produced by the new algorithm tracks changes in the sun (left) over time. In the thematic map, different colors correspond to different themes: yellow corresponds to active regions while dark blue shows quiet solar regions. Credit: NCEI/CIREs/CU Boulder]()
The SUVI thematic map (right) produced by the new algorithm tracks changes in the sun (left) over time. In the thematic map, different colors correspond to different themes: yellow corresponds to active regions while dark blue shows quiet solar regions. Credit: NCEI/CIRES/CU Boulder Computers are learning to find solar flares and other events in vast streams of solar images and help NOAA forecasters issue timely alerts, according to a new study in the Journal of Space Weather and Space Climate. The machine-learning technique, developed by scientists at the National Centers for Environmental Information (NCEI) and the Cooperative Institute for Research in Environmental Sciences (CIRES), searches massive amounts of satellite data to pick out features significant for space weather. Changing conditions on the sun and in space can affect various technologies on Earth, blocking radio communications, damaging power grids, and diminishing navigation system accuracy. GOES-R Series Solar Ultraviolet Imager (SUVI) data is being used to generate solar thematic maps that will serve as the basis for a variety of new space weather products from NOAA’s Space Weather Prediction Center.
December


-
November 26, 2019: Active 2019 Atlantic Hurricane Season Comes to an End
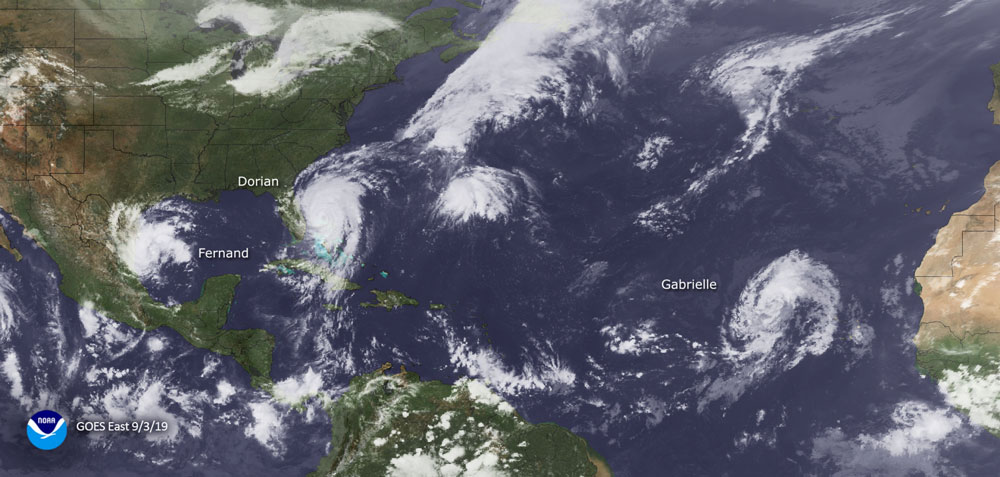
![GOES-16 (GOES East) view of storms Ferdinand, Dorian and Gabrielle on September 3, 2019.]()
GOES-16 (GOES East) view of storms Ferdinand, Dorian and Gabrielle on September 3, 2019. The 2019 Atlantic hurricane season, which ends on November 30, was marked by tropical activity that churned busily from mid-August through October. The season produced 18 named storms, including six hurricanes of which three were “major” (Category 3, 4 or 5). NOAA’s outlook called for 10-17 named storms, 5-9 hurricanes and 2-4 major hurricanes, and accurately predicted the overall activity of the season. This year marks the fourth consecutive above-normal Atlantic hurricane season. The only other period on record that produced four consecutive above-normal seasons was 1998-2001. Also this year, five tropical cyclones formed in the Gulf of Mexico, which ties a record with 2003 and 1957 for the most storms to form in that region. Take a look back at the 2019 Atlantic Hurricane Season with NOAA.
-
November 21, 2019: NOAA Administrator’s Awards
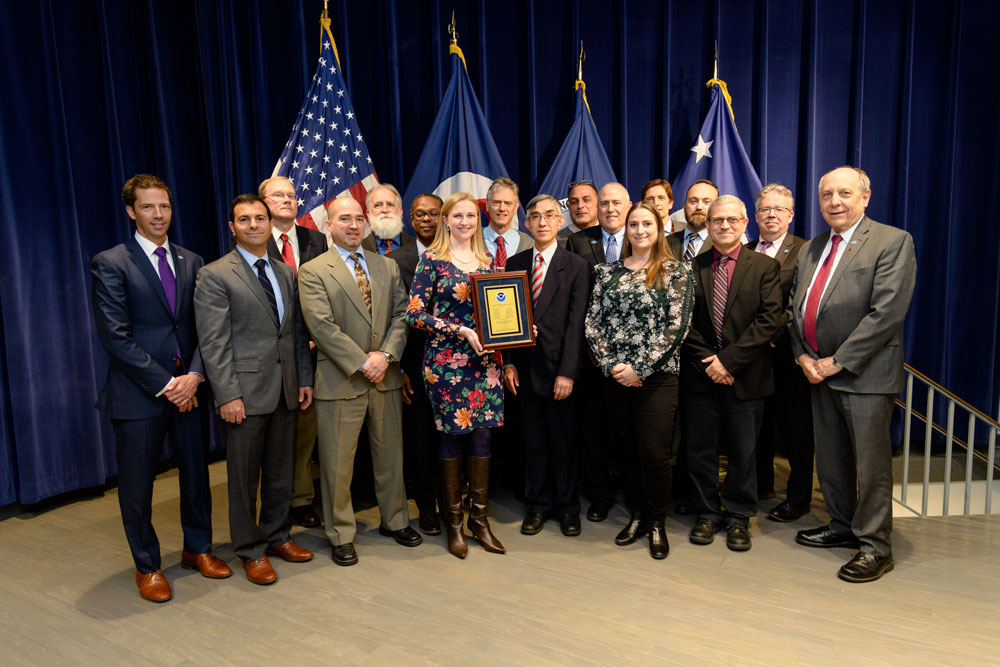
![2019 Administrator’s Award recipients, including GOES-R’s Kathryn Mozer and Elizabeth Kline, who were honored for innovation and collaborative problem-solving to establish NWS’ operational readiness for new weather-satellite data products.]()
2019 Administrator’s Award recipients, including GOES-R’s Kathryn Mozer and Elizabeth Kline, who were honored for innovation and collaborative problem-solving to establish NWS’ operational readiness for new weather-satellite data products. Several GOES-R team members were recipients of the 2019 NOAA Administrator’s Award at a ceremony on November 21. Pam Sullivan and Dan Lindsey were part of a team recognized for the extraordinary effort to recover the capability of the GOES-17 Advanced Baseline Imager for our nation’s weather forecasting needs. A team including Matthew Seybold, Kathryn Mozer, and Elizabeth Kline was recognized for innovation and collaborative problem solving to establish the National Weather Service’s operational readiness for new weather satellite data products. The NOAA Administrator’s Award recognizes employees who have demonstrated exceptional leadership, skill, and ingenuity in their significant, unique, and original contributions to NOAA, the Department of Commerce, and the Federal Government.
-
November 15, 2019: Measuring Winds to Help Predict the Weather
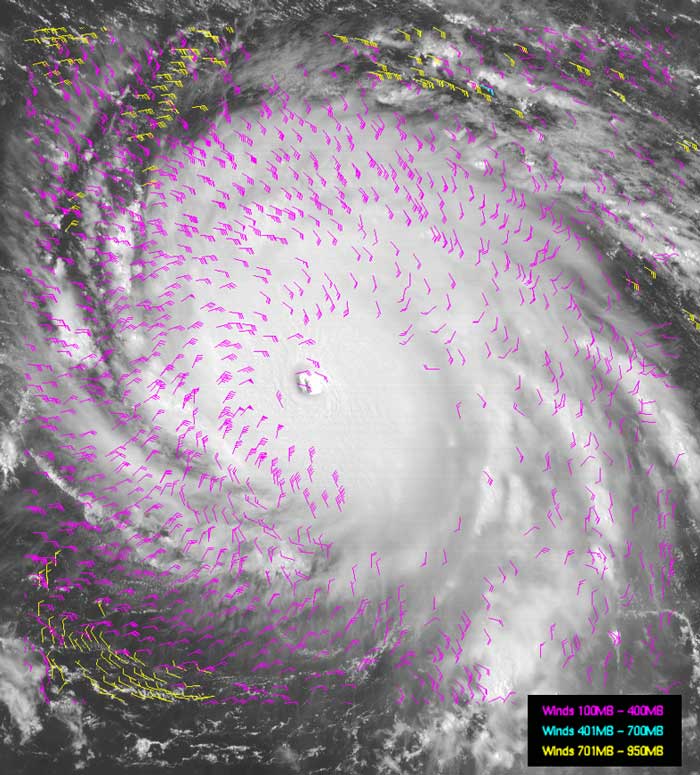
![GOES-16 winds generated over Hurricane Irma on September 6, 2017, overlaid on GOES-16 visible imagery.]()
GOES-16 winds generated over Hurricane Irma on September 6, 2017, overlaid on GOES-16 visible imagery. Wind is a fundamental variable of weather. The heating of Earth’s surface and atmosphere by the sun drives winds that move heat and moisture from one place to another. Variations in large-scale wind circulation patterns are responsible for the daily weather we experience. Satellite wind estimates help forecasters understand current weather conditions and contribute important information to global weather prediction models. Satellites like GOES-16 and GOES-17 estimate winds by tracking the motion of clouds (or water vapor features in the absence of clouds) observed in a sequence of mages. Thanks to improved resolution, faster scanning, and new imager channels, the GOES-R Series is providing more and better estimates of winds. This means improved tools for forecasters and a better understanding of impending severe weather.
-
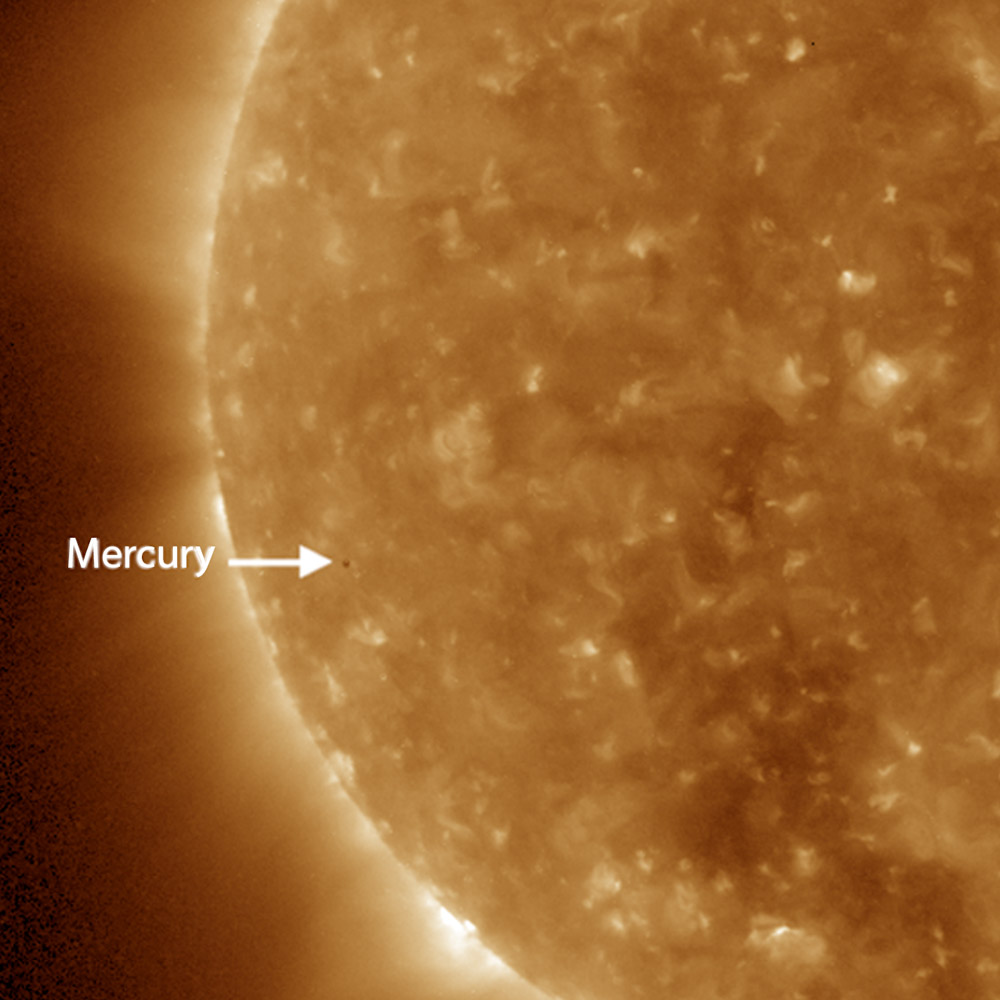
November 11, 2019: Mercury Transit
![GOES-16 SUVI image of the Mercury transit at 8:00 a.m. EST on November 11, 2019, near the beginning of the transit.]()
GOES-16 SUVI image of the Mercury transit at 8:00 a.m. EST on November 11, 2019, near the beginning of the transit. On November 11, 2019, the planet Mercury passed directly between the sun and Earth and the GOES-16 Solar Ultraviolet Imager (SUVI) instrument tracked the transit. The event lasted for approximately five and a half hours, from 7:35 a.m. to 1:04 p.m. EST. During the transit, Mercury appeared as a tiny black dot moving across the sun. Transits of Mercury only happen about 13 times per century – the next transit will be in 2032 and in the U.S., the next opportunity to catch a Mercury transit is in 2049. View a time-lapse animation of the Mercury Transit
November
-
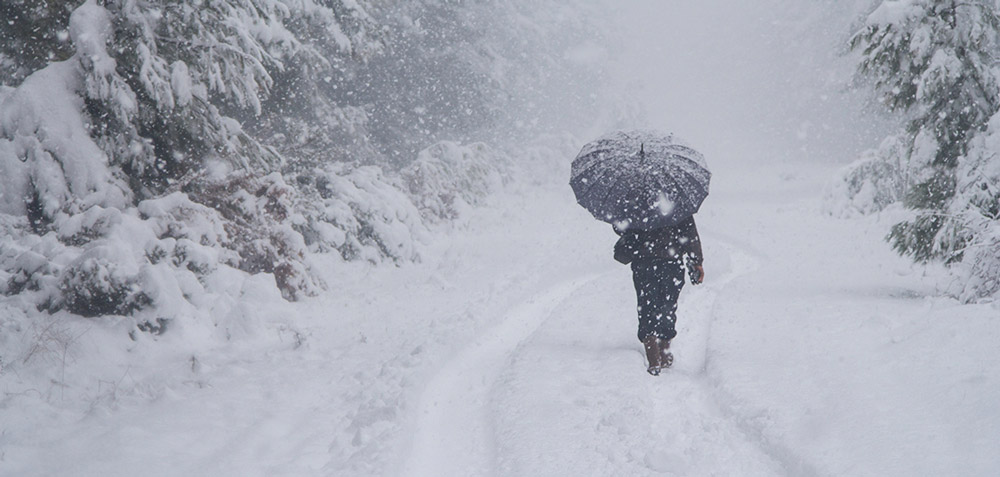
October 24, 2019: Winter’s on its Way — NOAA Satellites Have You Covered
![Winter is just around the corner.]()
Winter is just around the corner. As we move into the colder and snowy months of the year, NOAA’s next generation of geostationary and polar-orbiting satellites will be a critical source for monitoring and forecasting whatever weather winter throws our way. GOES-16 and GOES-17 bring state-of-the-art observational capabilities, with the 16-band Advanced Baseline Imager (ABI) and the first-of-its-kind Geostationary Lightning Mapper (GLM). These sensors give scientists and forecasters better and faster weather data during the United States’ often-turbulent winter months.
-
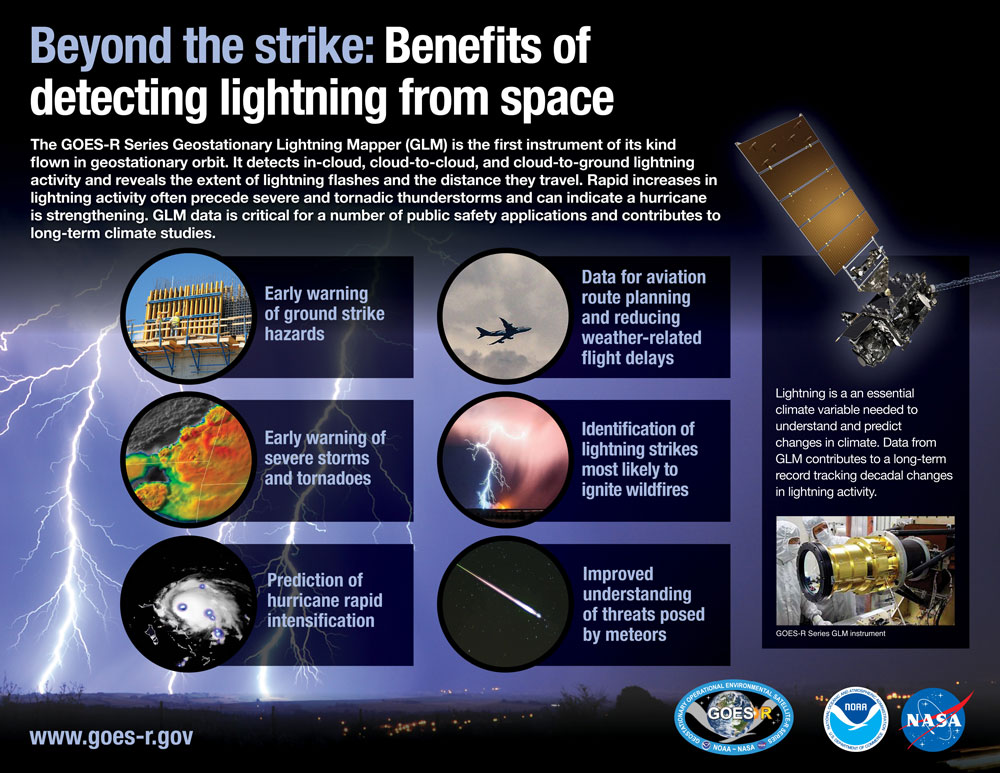
October 17, 2019: Beyond the strike: Benefits of detecting lightning from space
![Beyond the strike: Benefits of detecting lightning from space]()
The GOES-R Series Geostationary Lightning Mapper (GLM) is the first instrument of its kind in geostationary orbit. It detects total lightning (in-cloud and cloud-to-ground) activity and reveals the spatial extent and distance lightning flashes travel. Rapid increases in total lightning activity often precede severe and tornadic thunderstorms and can be an indication that a hurricane is strengthening. GLM data is critical for a number of public safety applications as well as for predicting changes in climate.
-
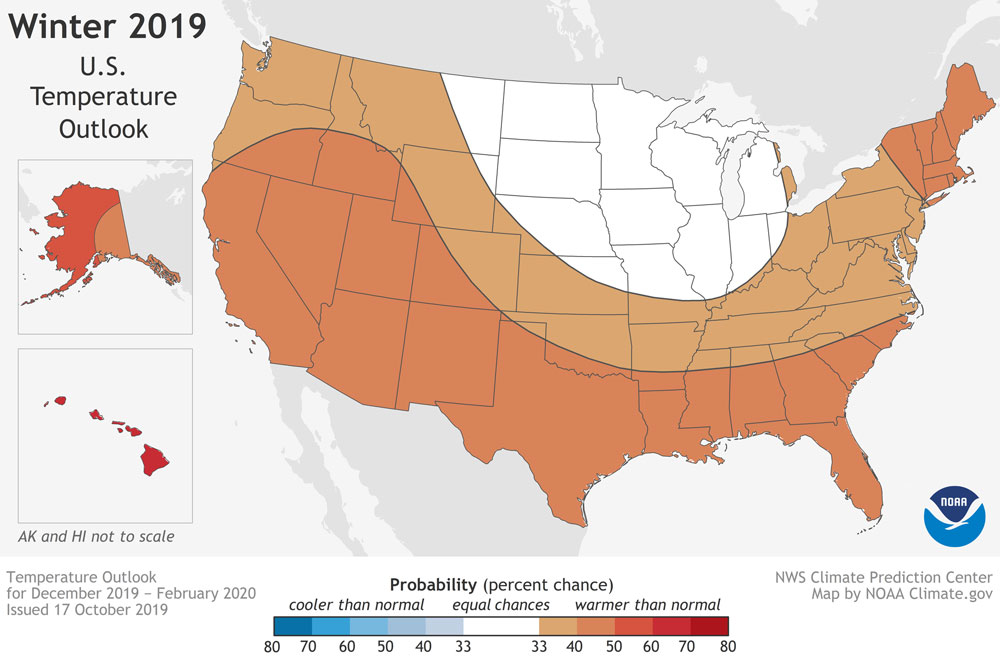
October 17, 2019: NOAA Issues 2019-2020 Winter Outlook
![NOAA’s 2019-20 Winter Outlook map for temperature shows warmer-than-average temperatures are likely for much of the U.S. this winter.]()
NOAA’s 2019-20 Winter Outlook map for temperature shows warmer-than-average temperatures are likely for much of the U.S. this winter. Warmer-than-average temperatures are forecast for much of the U.S. this winter according to NOAA’s Climate Prediction Center. Although below-average temperatures are not favored, cold weather is anticipated and some areas could still experience a colder-than-average winter. Wetter-than-average weather is most likely across the northern tier of the U.S. during winter, which extends from December through February. NOAA’s seasonal outlooks provide the likelihood that temperatures and total precipitation amounts will be above-, near- or below-average, and how drought conditions are favored to change. The outlook does not project seasonal snowfall accumulations as snow forecasts are generally not predictable more than a week in advance. Even during a warmer-than-average winter, periods of cold temperatures and snowfall are expected. Seasonal outlooks help communities prepare for what is likely to come in the months ahead and minimize weather's impacts on lives and livelihoods.
-
October 16, 2019: Satellite Imagery RGBs: Adding Value, Saving Time
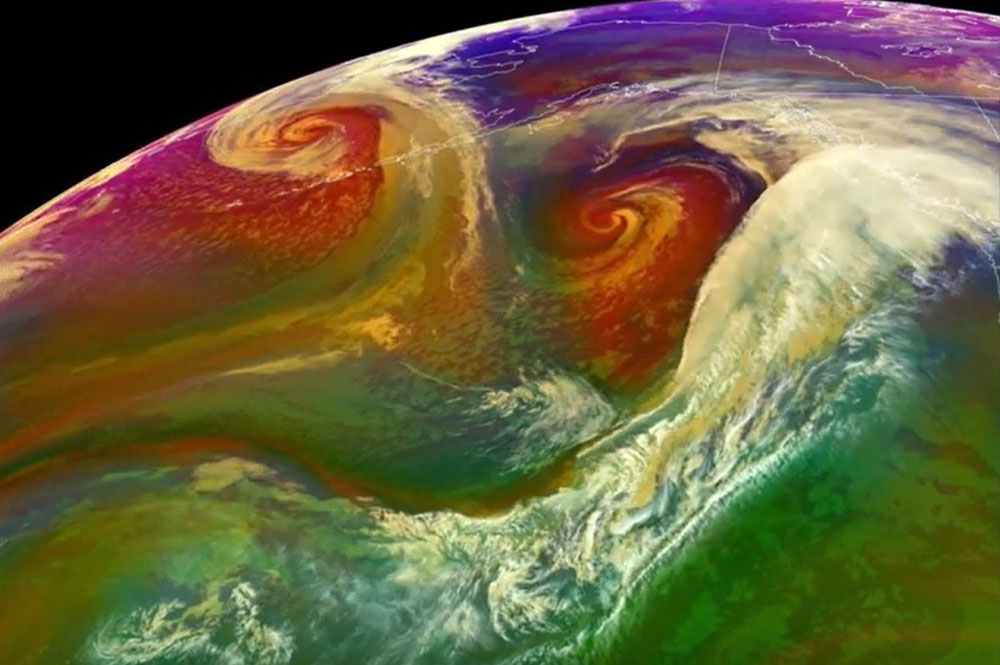
![This GOES-17 (GOES West) air mass RGB imagery shows a hurricane-force low (the remnants of Super Typhoon Hagibis) over the Bering Sea and a storm-force low over the Gulf of Alaska]()
This GOES-17 (GOES West) air mass RGB imagery shows a hurricane-force low (the remnants of Super Typhoon Hagibis) over the Bering Sea and a storm-force low over the Gulf of Alaska. With the advent of the GOES-R Series, forecasters now have an overwhelming amount of information to sift through. The Advanced Baseline Imager (ABI) instrument has 16 channels that image Earth’s weather, oceans and environment as often as every 30 seconds. How can meteorologists quickly discern the information they need to issue timely forecasts and warnings? Scientists are working on new ways to combine information from multiple ABI channels to enhance meteorological features of interest. The result is a variety of red-green-blue or “RGB” composite imagery. The stunning, colorful imagery you see from GOES-16 and GOES-17 isn’t just beautiful to look at, it also provides critical information to forecasters for situational awareness and nowcasting rapidly changing weather.
-
October 10, 2019: Understanding Satellite Images of Hurricanes
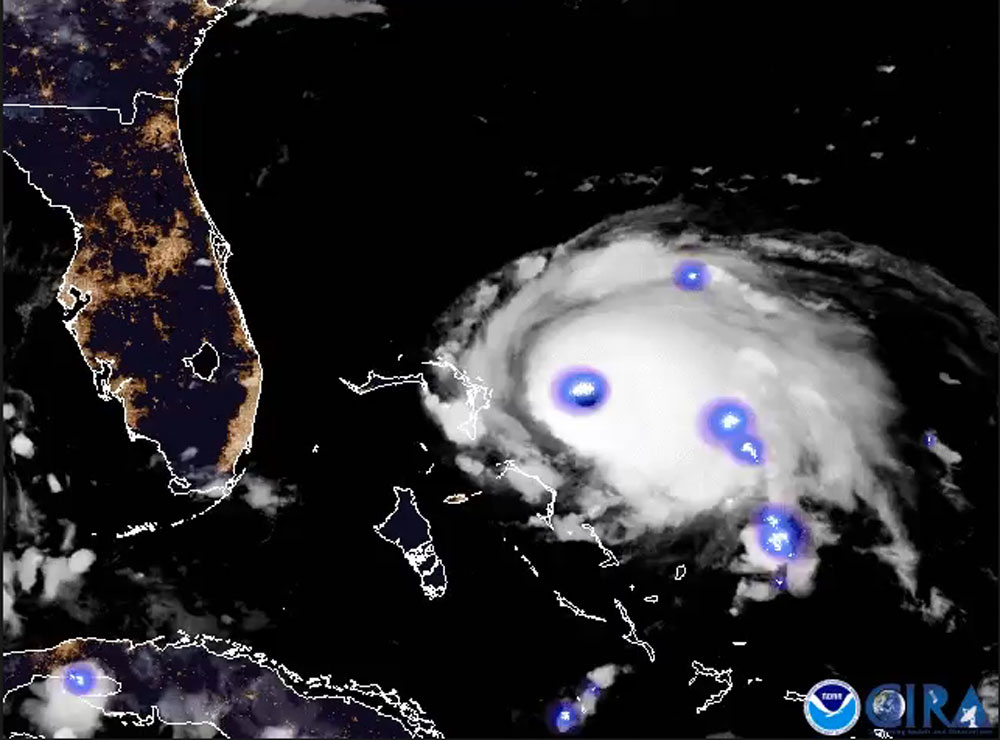
![Lightning in the eye and rainbands of Hurricane Dorian on September 1, 2019, captured by GOES-16 (GOES East)]()
Lightning in the eye and rainbands of Hurricane Dorian on September 1, 2019, captured by GOES-16 (GOES East). During a hurricane, instruments on NOAA-20 and S-NPP capture data twice a day. These data are converted into brightly colored pictures that reveal the structure, intensity and temperature of a storm, along with other features, such as lightning and gravity waves. GOES East and West satellites also show the storm’s evolution by measuring infrared and visible radiation from the atmosphere and surface in real-time. These measurements tell us about wind at various levels in the atmosphere, sea surface temperatures and cloud properties. During major storms, it’s common for these images to circulate on social media and surface in news articles and on television reports. But without the trained eye of a meteorologist, it can be a challenge for most people to know what to make of them. Using a series of images from Hurricane Dorian, NOAA created a guide to understanding satellite images of hurricanes.
-
October 9, 2019: 3rd Quarter 2019 GOES-R Program Newsletter
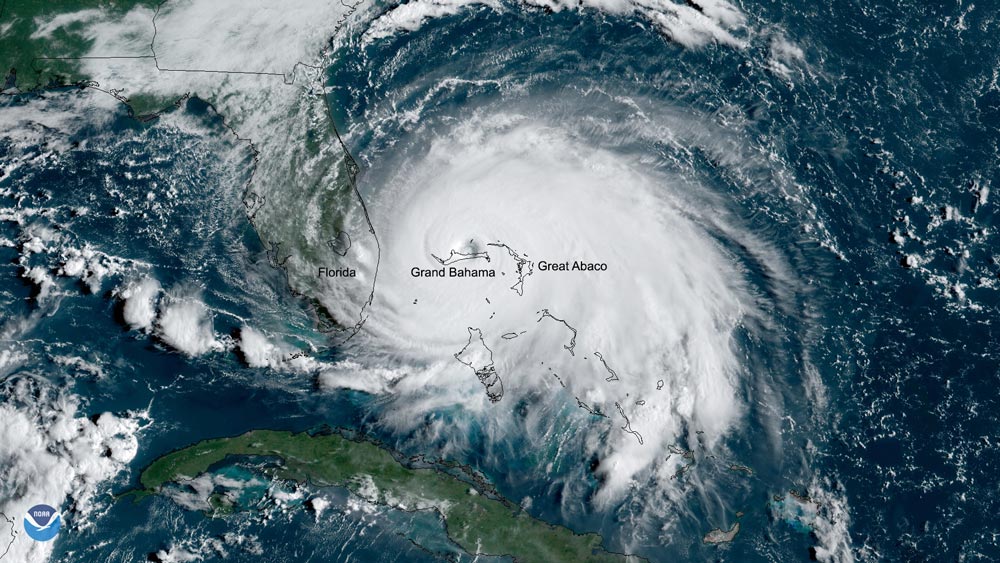
![Category 5 Hurricane Dorian over Grand Bahama on September 2, 2019]()
Category 5 Hurricane Dorian over Grand Bahama on September 2, 2019. The GOES-R Series Program quarterly newsletter for July – September 2019 is now available. We reached the peak of hurricane season in September with GOES-16 and GOES-17 keeping watch on the very active tropics. On September 18, there were six named storms across the Atlantic and Eastern Pacific hurricane basins, tying the modern record set in 1992. There were also two Category 5 hurricanes in September, Dorian and Lorenzo. GOES-16 also monitored the record fire activity in the Amazon. Our team continues to make great progress supporting our operational satellites and data products, building GOES-T and U, and upgrading our ground system. We are also spinning up efforts on what comes after the GOES-R Series, GEO-XO (Geostationary and Extended Orbits). Stay tuned!
-
October 3, 2019: NOAA to Engage Commercial Sector on Future Space Architecture Elements
On October 3, 2019, The National Environmental Satellite, Data, and Information Service (NESDIS) released a pair of Broad Agency Announcements (BAAs) to engage the commercial sector in developing new concepts for instruments, spacecraft, business models, and mission elements for NOAA’s future space-based observation architecture beyond the JPSS and GOES-R systems. The Geostationary and Extended Orbits (GEO-XO) BAA seeks white papers that will lead into funded concept studies of instrument and architecture concepts for remote sensing capabilities in geostationary and extended orbits. These instrument and mission concepts would serve to continue capabilities currently supported by GOES-R, SWFO, DSCOVR, and other solar observation satellites. On October 17-18, NESDIS will hold an Industry Day in Silver Spring, Maryland, in support of the BAAs issued on October 3, for interested parties to gather more information on the BAA process and the specifics of each BAA.
October
-
September 23, 2019: Unprecedented Capabilities for Monitoring Hurricanes
![Unprecedented Capabilities for Monitoring Hurricanes]()
GOES-16 and GOES-17 continuously view the entire Atlantic and Eastern/Central Pacific hurricane basins. New and upgraded instrumentation and data products provide early warning that a hurricane is forming, improve forecasting, tracking and monitoring of storms, and even aid emergency response to flooding from landfalling hurricanes. This vital information can help forecasters better understand and predict the behavior of hurricanes, improving public safety and protecting life and property.
-
September 19, 2019: Lifecycle of a Fire Disaster
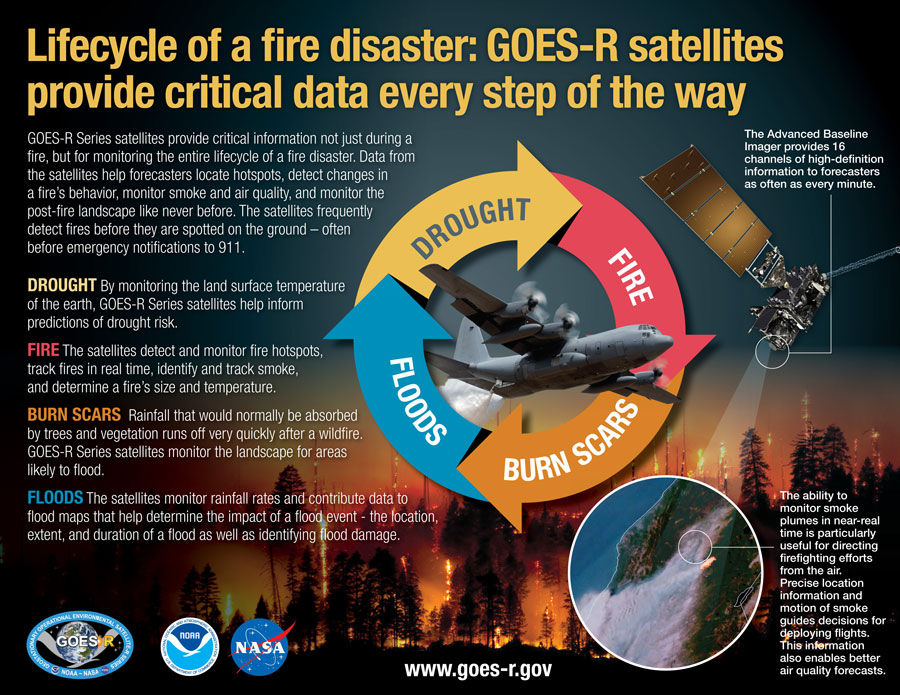
![Lifecycle of a Fire Disaster]()
The benefits from GOES-16 and GOES-17 aren’t just seen during a fire but are important in monitoring the entire lifecycle of a fire disaster. Data from the satellites are helping forecasters monitor drought conditions, locate hotspots, detect changes in a fire’s behavior, predict a fire’s motion, monitor smoke and air quality, and monitor the post-fire landscape like never before. This new infographic shows how GOES-16 and GOES-17 provide critical data every step of the way.
-
September 18, 2019: Dive Into NOAA’s Treasure Trove of Data
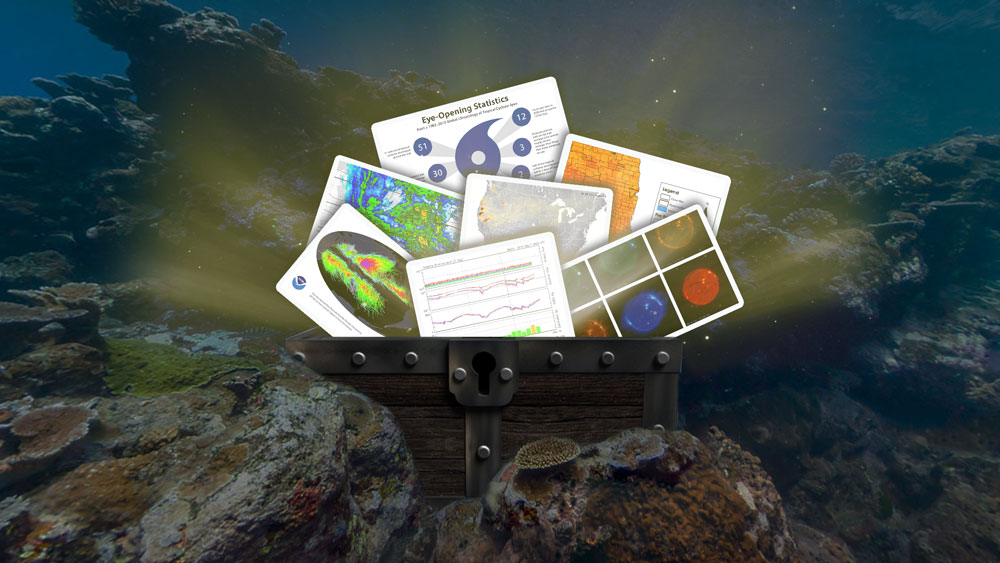
![Dive Into NOAA’s Treasure Trove of Data]()
NOAA’s treasure trove of data. NOAA is highlighting the amazing things we can learn from data throughout the month of September during a celebration known as NOAA DataFest. After all, NOAA data are freely available to all who want to learn about the world and its many mysteries. NOAA DataFest also aims to educate the public and inspire our colleagues at NOAA to learn more about the robust collection of scientific Earth and environmental observations that NOAA provides while celebrating its value, reliability, and accessibility. One NOAA DataFest event is #Datapalooza — a Twitter chat/relay that invites scientists from all over the world, as well as our external partners and the public, to discuss the many ways they use NOAA data or ask questions about it. This year NOAA will be hosting conversations on three different topics throughout Thursday, Sept. 26 – Tropical Weather, Space Weather, and Fire Weather. GOES-R data is vital to each of these topics.
-
September 17, 2019: NOAA Sees the Fifth Hurricane Humberto Through High-powered Lens
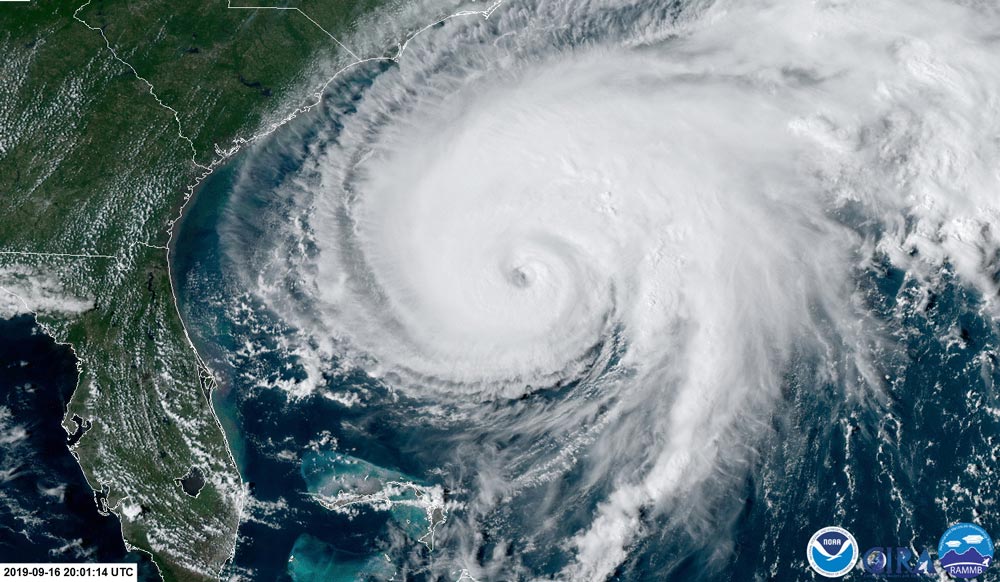
![Hurricane Humberto as seen by GOES-16 on September 16, 2019]()
Hurricane Humberto as seen by GOES-16 on September 16, 2019. This season’s Humberto isn’t the first tropical cyclone in the Atlantic Basin to be given the name. In fact, it’s the fifth Hurricane Humberto to emerge in the Atlantic, but this time, NOAA is watching through the sophisticated Advanced Baseline Imager (ABI) of GOES-16 (GOES East). Humberto replaced the name Hugo on the World Meteorological Organization’s list of Atlantic hurricane names after Hurricane Hugo’s devastation in 1989 prompted its name to be retired. This season’s Humberto arrived during the new era of the GOES-R Series This new generation of NOAA weather satellites is equipped with advanced sensors and instruments that are providing unprecedented, real-time monitoring of weather from space.
-
September 10, 2019: NOAA’s Aviation Weather Center has your (seat) back on every flight
![A passenger aircraft undergoes maintenance in preparation for flight]()
A passenger aircraft undergoes maintenance in preparation for flight. If you were one of the more than 2.5 million people who flew safely through a U.S. airport today, you might want to thank your flight crew and a specialized team of meteorologists working behind the scenes. Aviation weather forecasting is important business: At any given time there are 5,000 aircraft crossing the skies over the U.S. According to the Federal Aviation Administration (FAA), inclement weather is by far the leading cause of flight delays, and delays cost airlines and passengers billions of dollars each year. NOAA aviation meteorologists work alongside FAA colleagues to ensure that any rapid changes in weather are quickly communicated to pilots in the sky. GOES data is an important part of those forecasts.
-
September 9, 2019: How Bits and Bytes of Data Become a Forecast
![How bits and bytes of data become a forecast]()
How bits and bytes of data become a forecast. Every day in America, millions of people wake up with the same question on their minds, “What’s the weather today?” The US Department of Commerce found that the majority of Americans check the weather forecast 3.8 times per day, equating to 301 billion forecasts consumed per year! These days, we take accurate forecasts — available multiple days in advance — for granted. This information wasn’t always as readily available as it is today. It takes a lot of smart science, technological infrastructure, and computing power to get the right data and information to generate a forecast. And the value of that information is profound. It helps people answer a wide variety of questions, from “What will I wear today?” to “When should I harvest my crops,” “When should I ship my product” or “When should I evacuate to avoid the storm?
-
September 3, 2019: NOAA DataFest
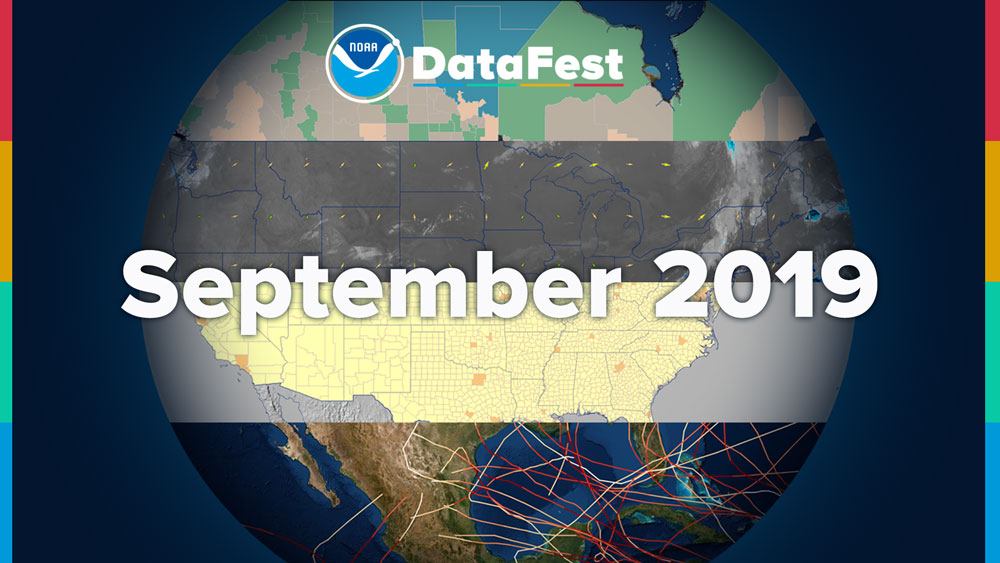
![NOAA DataFest.]()
From the bottom of the ocean to a million miles from Earth, NOAA has a robust collection of scientific Earth and environmental data that are free and accessible to everyone. Throughout September, you can look forward to hearing from experts in the data-realm as they delve into everything from computer learning for conservation to visualizing uncertainty. Join the conversation on Twitter using #Datapalooza and ask all your burning NOAA data questions!
September

-
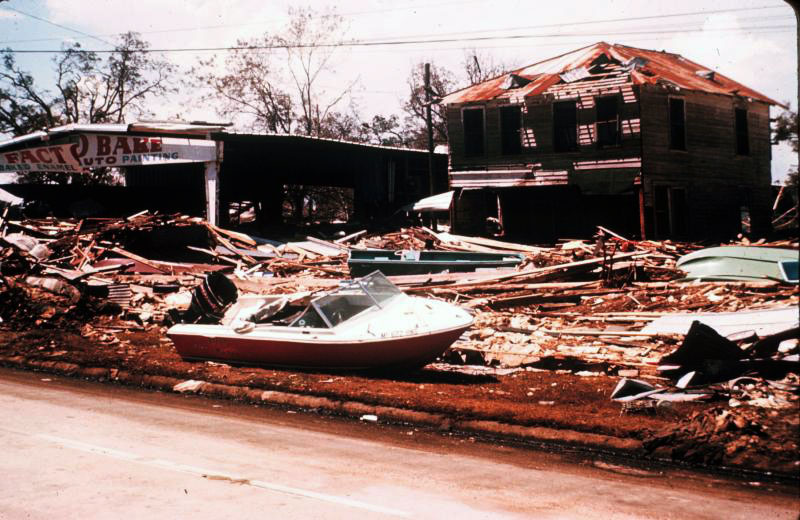
August 16, 2019: 50 Years After Hurricane Camille, NOAA Satellites Keep U.S. Weather-Ready
![Damage from Hurricane Camille in 1969.]()
Damage from Hurricane Camille in 1969. In the late evening hours of August 17, 1969, a catastrophic storm named Hurricane Camille slammed into the Gulf Coast. A Category 5 hurricane, with sustained winds of 175 mph and a storm surge of more than 24 feet, Camille devastated much of coastal Mississippi, Alabama and Louisiana. In 2016, came the next generation of environmental observation satellites that significantly improved tropical cyclone forecasting and severe weather prediction. Today, GOES-16 and GOES-17 provide unprecedented views of hurricanes from space.
-
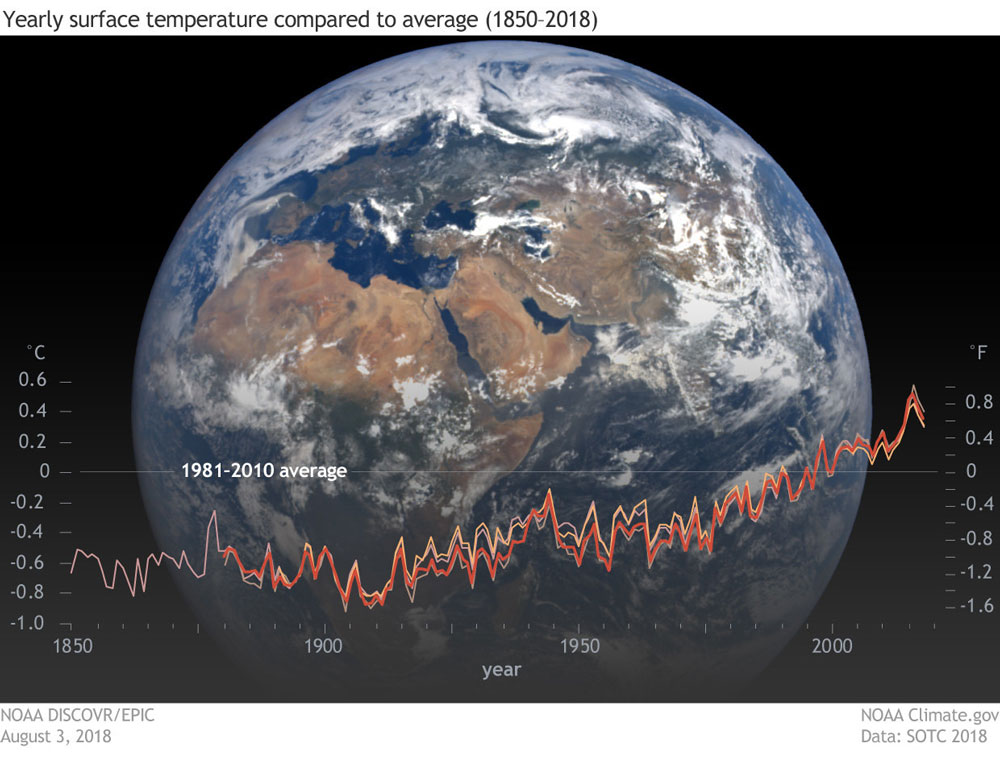
August 12, 2019: State of the Climate in 2018
![Yearly surface temperature compared to average (1850-2018)]()
Yearly surface temperature compared to average (1850-2018) An international, peer-reviewed publication released each summer, the State of the Climate is the authoritative annual summary of the global climate published as a supplement to the Bulletin of the American Meteorological Society. The report, compiled by NOAA’s National Centers for Environmental Information, is based on contributions from scientists from around the world. It provides a detailed update on global climate indicators, notable weather events, and other data collected by environmental monitoring stations and instruments located on land, water, ice, and in space. According to the report, 2018 was the fourth warmest year on record, dating back to the 1800s. Greenhouse gases were the highest on record, global sea level was the highest on record, and global surface temperature and sea surface temperature were near record high.
-
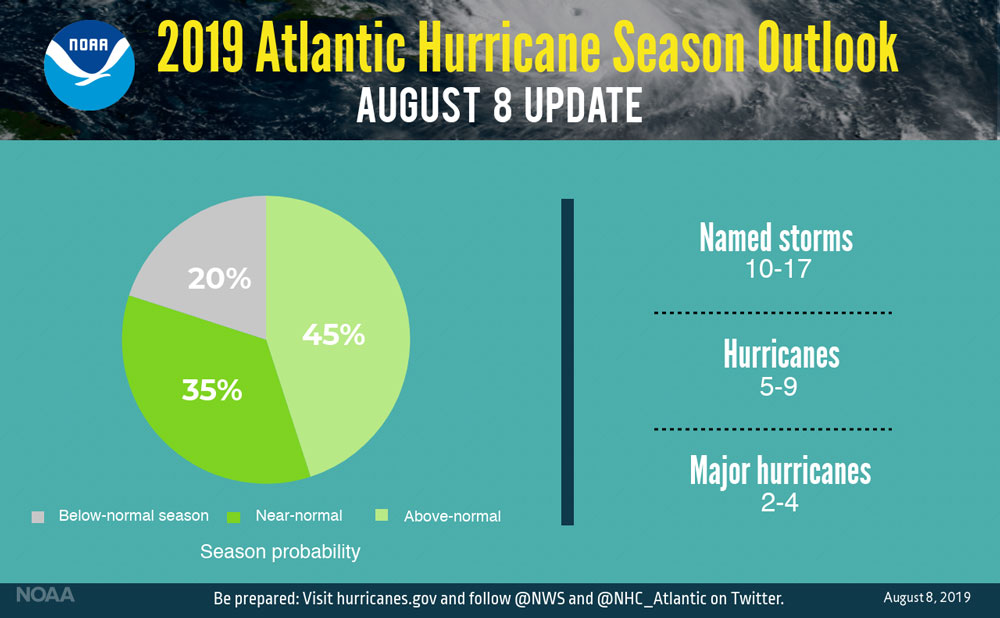
August 8, 2019: NOAA Increases Chance for Above-Normal Hurricane Season
![The updated 2019 Atlantic hurricane season probability and numbers of named storms. (NOAA)]()
The updated 2019 Atlantic hurricane season probability and numbers of named storms. (NOAA) NOAA forecasters monitoring oceanic and atmospheric patterns say conditions are now more favorable for above-normal hurricane activity since El Nino has now ended. Two named storms have formed so far this year and the peak months of the hurricane season, August through October, are now underway. Seasonal forecasters with NOAA’s Climate Prediction Center have increased the likelihood of an above-normal Atlantic hurricane season to 45% (up from 30% from the outlook issued in May). The likelihood of near-normal activity is now at 35%, and the chance of below-normal activity has dropped to 20%. The number of predicted storms is also greater with NOAA now expecting 10-17 named storms (winds of 39 mph or greater), of which 5-9 will become hurricanes (winds of 74 mph or greater), including 2-4 major hurricanes (winds of 111 mph or greater).
-
August 5, 2019: How Do Hurricanes Form?
Hurricanes are very large and intense storms. But where do these giant storms come from? Learn how hurricanes form and how GOES-R satellites can help predict a storm's intensity and track it minute-by-minute. This information allows meteorologists to deliver early warnings and help people stay safe.
-
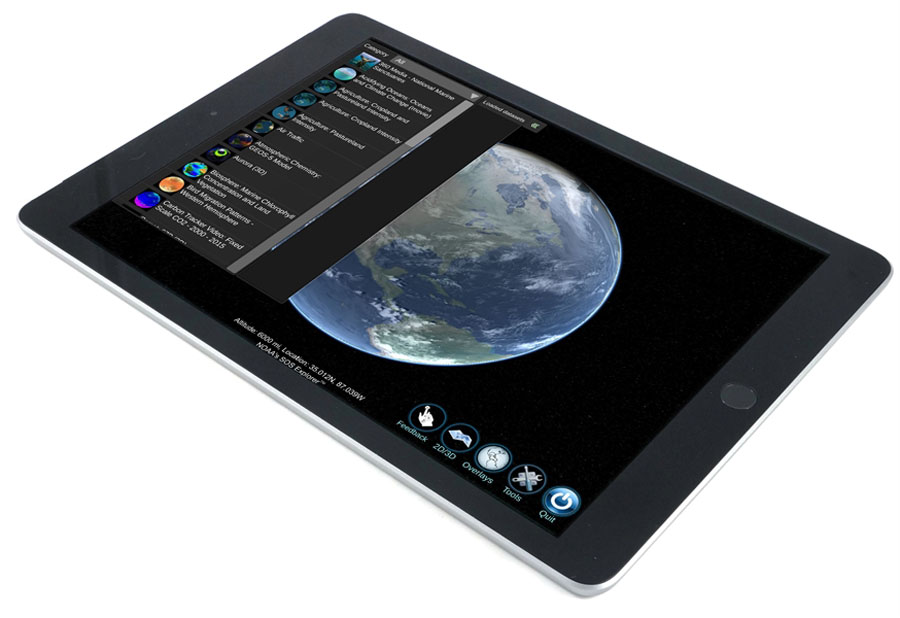
August 2, 2019: NOAA Science on a Sphere Explorer Mobile App
![NOAA SOS Explorer App]()
NOAA SOS Explorer App A new NOAA app brings earth and space animations to your phone. NOAA's SOS Explorer™ Mobile, an app for personal mobile devices, tells earth science stories by playing visually stunning data animations on a virtual globe. SOSx Mobile offers more than 115 datasets from NOAA, NASA, and academic institutions, including: Climate models predicting Earth’s temperature through 2100 for different greenhouse gas emissions scenarios; National Marine Sanctuaries’ 360-degree underwater photographs in the Florida Keys; and the entire 2017 hurricane season, including Hurricanes Irma and Maria, as captured by NOAA weather satellites.
August
-
July 31, 2019: GOES-U Spacecraft Mate Complete
![GOES-U spacecraft mate. Courtesy of Lockheed Martin.]()
GOES-U spacecraft mate. Courtesy of Lockheed Martin. The GOES-U satellite system module and core module were mated on July 31, 2019, and now form the GOES-U spacecraft. This is an important milestone in the development of the satellite, as it merges together the elements that form both the “brain” and the “body” of the satellite. More than 70 electronics boxes mounted within the system module provide the functionality to operate the spacecraft and its six instruments. The core module forms the main central structure of the satellite and carries the propellant needed to maneuver the spacecraft after it is separated from the launch vehicle and operational in geostationary orbit.
-
July 30, 2019: Wildfires from Space: How the View from Above Helps Firefighters on the Ground
GOES 16 (GOES East) imagery of the “Camp Fire” in northern California on November 8, 2018. Firefighters do the heavy lifting when it comes to fighting and managing wildfires, but they’re often helped by the view from above, thanks to coordinated satellite observations and high-flying airplanes. A large global constellation of satellites, operated by NASA and National Oceanic and Atmospheric Administration (NOAA), combined with a small fleet of planes operated by the U.S. Forest Service (USFS) help detect and map the extent, spread and impact of forest fires. GOES-16 and GOES-17 aid this effort, often spotting fires before they are reported on the ground.
-
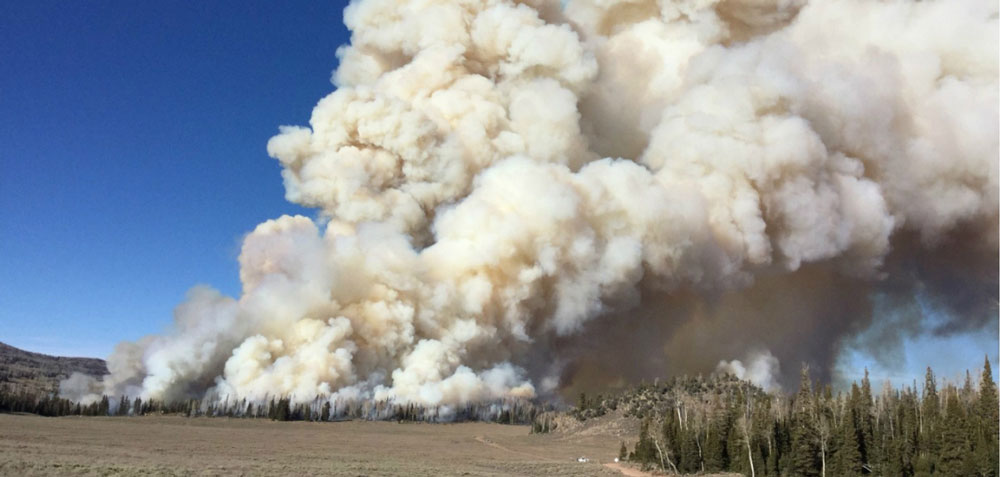
July 22, 2019: Where There’s Fire, There’s Smoke — and Secrets for Science to Uncover
![Fish Lake burn in 2017. Credit: USFS]()
Fish Lake burn in 2017. Credit: USFS Extreme wildfire seasons are no longer an outlier in the western United States, where climate change is drying out vegetation and people are moving deeper and deeper into western forests. All that fire produces a lot of smoke — and a serious air pollution problem. This summer, NOAA and NASA are teaming up on a massive research campaign called FIREX-AQ that will use satellites (including GOES-16 and GOES-17), aircraft, drones, mobile and ground stations to study smoke from wildfires and agricultural crop fires across the U.S. Hundreds of scientists will explore the chemistry of trace gases and aerosols in smoke to uncover its secrets, improve weather and air quality models, and provide better forecasts to first responders, public health and land management officials. FIREX-AQ website.
-
July 15, 2019: 2nd Quarter 2019 GOES-R Program Newsletter
![GOES-T in a Lockheed Martin cleanroom.]()
GOES-T in a Lockheed Martin cleanroom. The GOES-R Series Program quarterly newsletter for April – June 2019 is now available. GOES-16 and GOES-17 continue to provide high definition imagery to forecasters, monitoring Hurricane Barry as it came ashore near New Orleans, viewing the first eruption of the Raikoke volcano in the northwest Pacific since 1924, and even detecting a refinery explosion in Philadelphia and an asteroid entering Earth’s atmosphere south of Puerto Rico. Meanwhile, the program is focused on the redesign of the Advanced Baseline Imager radiator and the repair of the Geostationary Lightning Mapper to support the new GOES-T launch planning date of December 2021. The Ground Segment server replacement is also progressing, on plan to be completed before the GOES-T launch. GOES-U’s new space weather instrument, the Compact Coronagraph, passed its Critical Design review and is proceeding with fabrication.
-
July 08, 2019: NOAA/NASA Satellite Meteorology Summer Workshop
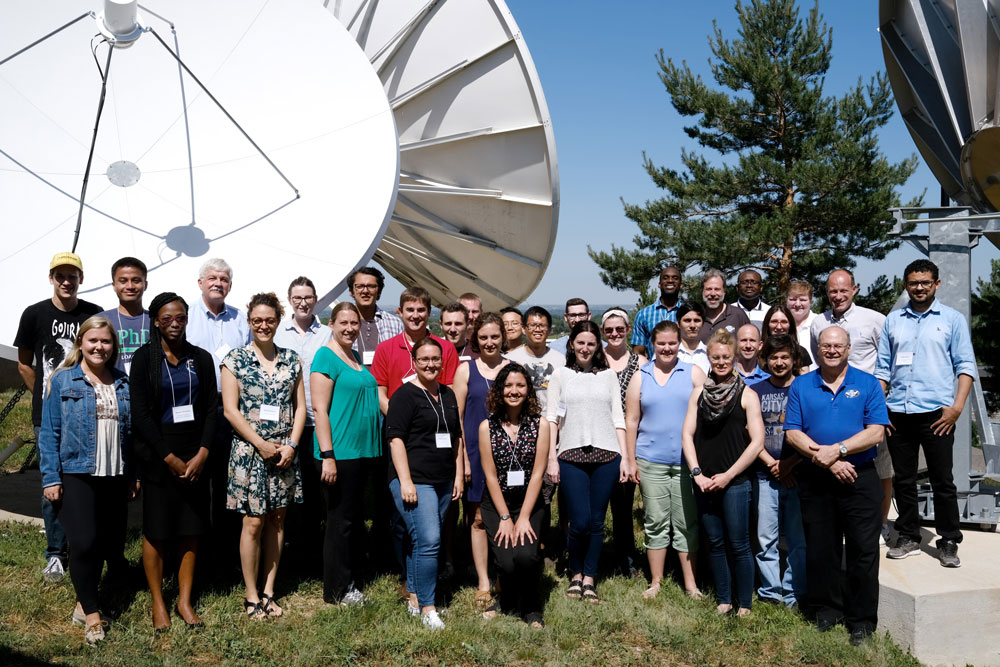
![NOAA/NASA Satellite Meteorology Summer Workshop participants with GOES-R instructors.]()
NOAA/NASA Satellite Meteorology Summer Workshop participants with GOES-R instructors. NOAA/NESDIS and the NASA Earth Sciences Division are holding a Satellite Meteorology Summer Workshop July 8-19 at the Cooperative Institute for Research in the Atmosphere (CIRA) in Fort Collins, Colorado. The workshop focuses on the theory and use of satellite data to engage graduate students and individuals with early postdoctoral appointments in the science of developing and using satellite data for the atmosphere, land, oceans and cryosphere. The program includes internationally recognized experts in radiative transfer theory, satellite meteorology, and numerical weather prediction at both the global scale and mesoscale. The objective of the workshop is to foster education of the next generation of satellite meteorologists and promote the use of observations from the latest operational and research satellite missions.
-
July 03, 2019: Parts of Chile and Argentina Experience Total Solar Eclipse
GOES East saw the moon’s shadow as it moved west to east across South America on July 2, 2019. Parts of Chile and Argentina experienced a total solar eclipse, which is when the moon passes between the sun and Earth, blocking out all of the light from the sun. Those in the path of totality were able to see the sun’s corona. While the eclipse began over the Pacific Ocean, La Serena, Chile, was one of the first cities in the path of totality to view the eclipse.
-
July 01, 2019: GOES-U Gets a New Instrument
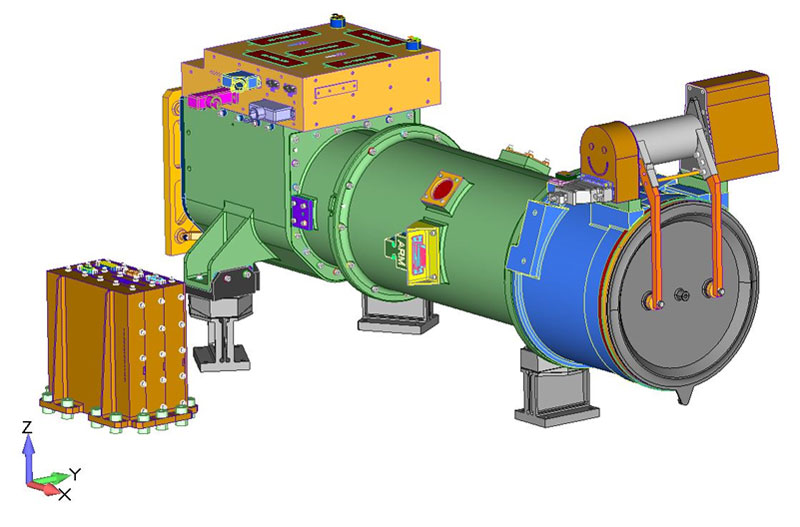
![Model of CCOR, courtesy of the Naval Research Laboratory]()
Model of CCOR, courtesy of the Naval Research Laboratory. GOES-U, scheduled to launch in late 2024, won’t be an exact replica of its siblings in the GOES-R Series. That’s because GOES-U will accommodate an additional space weather instrument, the Naval Research Laboratory’s Compact Coronagraph (CCOR). CCOR recently completed its Critical Design Review, which affirmed that the design meets requirements and is ready to proceed with full-scale fabrication, assembly, integration and test. CCOR will image the solar corona (the outer layer of the sun’s atmosphere) and help detect and characterize coronal mass ejections (CMEs).
July

-
June 21, 2019: GOES East and GOES West See Summer Solstice
![The daylight terminator (slanted shadow that separates day from night) is seen in both GOES West (left) and GOES East (right) imagery from June 21, 2019.]()
The daylight terminator (slanted shadow that separates day from night) is seen in both GOES West (left) and GOES East (right) imagery from June 21, 2019. On June 21, GOES East and GOES West simultaneously saw the slanted shadows separating day and night on Earth just minutes after the summer solstice occurred. Summer solstice is the start of astronomical summer in the Northern Hemisphere and the moment that hemisphere reaches its greatest tilt toward the sun. The solstice occurred at 11:54 a.m. EDT, when the sun's direct rays reached as far north as they could get, along the Tropic of Cancer, at 23.5 degrees North latitude. It was the longest day (and shortest night) of the year.
-
June 11, 2019: GOES-R Lightning Detection Fact Sheet
![GOES-16 GLM and ABI composite of lightning illuminating a mesoscale convective system over Uruguay.]()
GOES-16 GLM and ABI composite of lightning illuminating a mesoscale convective system over Uruguay. Rapid increases in total lightning (in-cloud and cloud-to-ground) activity often precede severe and tornadic thunderstorms. The GOES-R Series Geostationary Lightning Mapper (GLM) is the first operational lightning mapper flown in geostationary orbit. GLM data reveal convective storm development and evolution and provide insights beyond the presence of a lightning strike, including the spatial extent and distance lightning flashes travel. Trends in total lightning available from GLM provide critical information to forecasters, allowing them to identify initial thunderstorm development and focus on potentially severe storms before they produce damaging winds, hail or tornadoes. GLM can also aid with aviation route planning and early recognition of conditions conducive to lightning-ignited wildfires. The instrument has even been found useful in identifying meteors entering the Earth’s atmosphere.
-
June 7, 2019: GOES-16/17 Virtual Science Fair Winners Announced
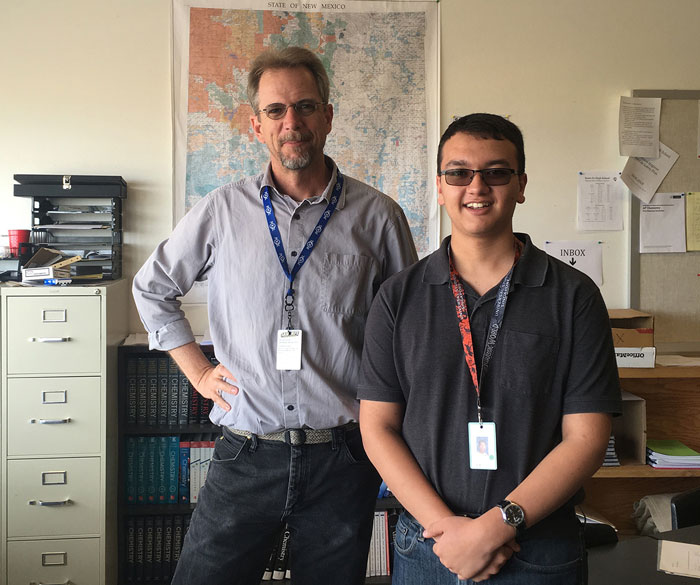
![GOES-16/17 Virtual Science Fair first place high school team from Santa Fe High School, coach Derek Buschman (left) and student Faris Wald (right).]()
GOES-16/17 Virtual Science Fair first place high school team from Santa Fe High School, coach Derek Buschman (left) and student Faris Wald (right). The winners of the 2019 GOES-16/17 Virtual Science Fair were announced on June 7. Two middle school teams tied for first place: Auburn, Massachusetts, and Medford New Jersey. The high school first place team is from Santa Fe, New Mexico. Students from grades 6-14 were invited to participate in the virtual science fair. Each team used data from GOES-16 and GOES-17 to investigate weather and natural hazards. View all the science project submissions.
-
June 5, 2019: GOES-R Fire Detection and Characterization Fact Sheet
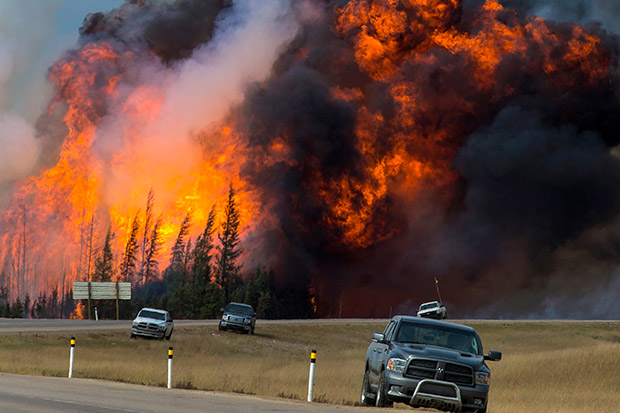
![Flames tower above the treeline next to Highway 63 south of Fort McMurray, Alberta, Canada, on May 7, 2016.]()
Flames tower above the treeline next to Highway 63 south of Fort McMurray, Alberta, Canada, on May 7, 2016. Fires, whether naturally occurring or manmade, have substantial impacts upon society. Wildfires can destroy vast tracts of land, releasing tons of aerosols and gases into the atmosphere, while destroying homes, wildlife habitats and valuable resources. Satellites allow for detecting and monitoring a range of fires, providing information about the location, duration, size, temperature, and power output of those fires that would otherwise be unavailable. With the GOES-R Series, this information can be used to track fires in real time, provide input data for air quality modeling, and help separate the impact of the fires from other sources of pollution. A new fact sheet highlights the new tools available for detecting and monitoring wildfires, observing and monitoring smoke from those fires, monitoring burn scars, and predicting flash flood events from rain events after a fire.
-
June 5, 2019: GOES-R Volcanic Ash Detection Fact Sheet
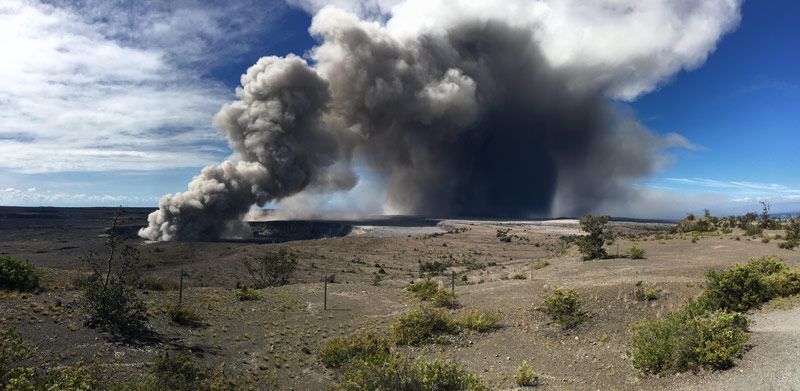
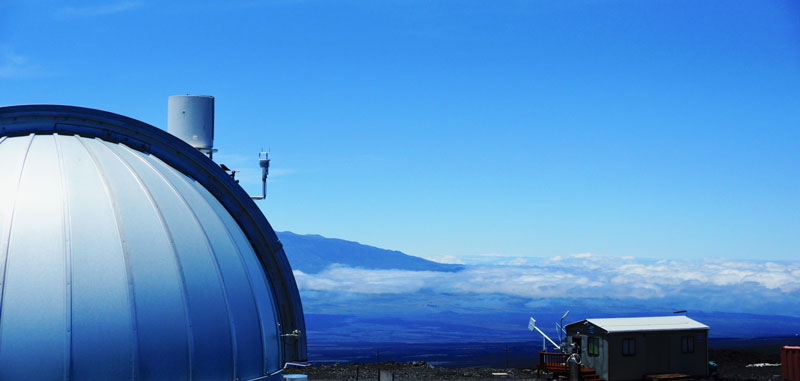
![NOAA’s Mauna Loa Observatory.]()
An ash plume rises from the Kilauea volcano in Hawaii on May 15, 2018. Volcanic ash is a significant health, aviation, infrastructure, and economic hazard. Volcanic emissions generate complex clouds that can affect local, regional, or, in the case of very large eruptions, global weather and climate. Given the remote location of most volcanoes and the rapid formation and expansion of volcanic clouds, geostationary satellites are the primary tool for identifying, tracking and characterizing volcanic clouds. GOES East and GOES West observe a significant fraction of the most volcanically active region on Earth, known as the “Pacific Ring of Fire.” The GOES-R Series provides a complete set of advanced volcanic cloud detection and monitoring products and tools. A new fact sheet highlights how forecasters use GOES-R volcanic ash applications to identify areas where ash is present and potentially hazardous and issue more accurate aviation, air quality, ground safety, and public health warnings.
-
June 4, 2019: Carbon Dioxide Levels in Atmosphere Hit Record High in May
![NOAA’s Mauna Loa Observatory.]()
NOAA’s Mauna Loa Observatory. Atmospheric carbon dioxide continued its rapid rise in 2019, with the average for May peaking at 414.7 parts per million (ppm) at NOAA’s Mauna Loa Atmospheric Baseline Observatory. The measurement is the highest seasonal peak recorded in 61 years of observations on top of Hawaii’s largest volcano and the seventh consecutive year of steep global increases in concentrations of carbon dioxide (CO2), according to data published on June 4, 2019, by NOAA and Scripps Institution of Oceanography. The 2019 peak value was 3.5 ppm higher than the 411.2 ppm peak in May 2018 and marks the second-highest annual jump on record.
-
June 3, 2019: Hurricane Research Gains Ground
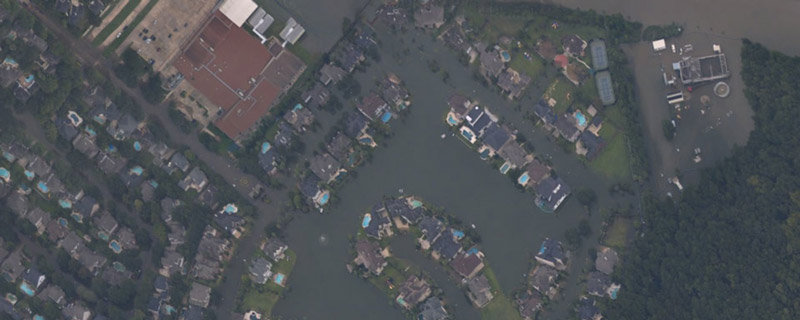
![Aerial photo of West Houston after Hurricane Harvey. Courtesy of NOAA Ocean Service.]()
Aerial photo of West Houston after Hurricane Harvey. Courtesy of NOAA Ocean Service. With significant coastal populations and property at stake, two new studies by NOAA’s National Centers for Environmental Information (NCEI) and its research partners focus on the behavior of tropical cyclones. Because hurricanes can cause fatalities and billions of dollars in damage, the new research could contribute to greater preparedness, improved forecasts, and resiliency efforts. These studies delve into the speed, direction, and intensity of tropical cyclones.
-
June 3, 2019: GOES-R Snow and Ice Fact Sheet
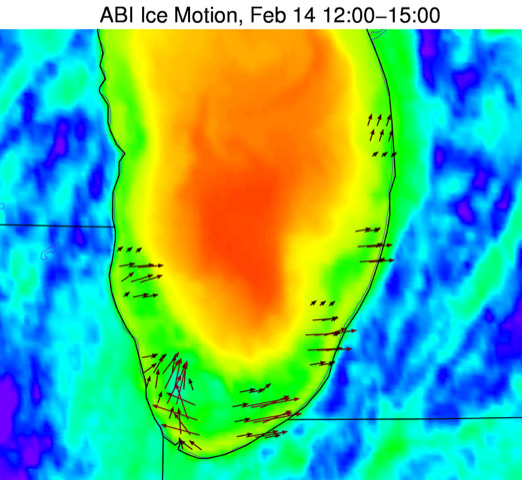
![Ice along the southern Lake Michigan shoreline (denoted by arrows) contrasts with the warmer, unfrozen lake water in this GOES-16 infrared imagery. Using a pair of images three hours apart, the ice motion code detected strong eastern/northeastern motion along the lakeshore.]()
Ice along the southern Lake Michigan shoreline (denoted by arrows) contrasts with the warmer, unfrozen lake water in this GOES-16 infrared imagery. Using a pair of images three hours apart, the ice motion code detected strong eastern/northeastern motion along the lakeshore. The cryosphere includes snow, sea ice, lake and river ice, icebergs, glaciers, ice caps, ice sheets, ice shelves, permafrost, seasonally frozen ground, and solid precipitation. Changes in the cryosphere have major impacts on water supply, agriculture, transportation, freshwater ecosystems, hydropower production, health, and recreation. Notable cryosphere-related hazards include floods, droughts, avalanches, and sea-level rise. Satellite instruments are essential for delivering large-scale observations of the cryosphere and are a key to extending ground-based measurements. A new fact sheet highlights snow and ice applications from the GOES-R Series. Cryospheric observations and information from the GOES-R Series provide a new opportunity to continuously observe snow and ice from geostationary orbit, improving weather forecasting and hazard warnings and helping to reduce the risk of loss of life and property from natural and human-induced disasters. These observations provide a better understanding of environmental factors that affect human health and well-being, are critical to marine navigation at high latitudes, and improve the management of water resources, and terrestrial, coastal and marine ecosystems.
June

-
May 23, 2019: New Tools for Monitoring Hurricanes in a Changing Climate
![GOES-16 GeoColor image of Hurricane Harvey on August 26, 2017, after it made landfall on the Texas coast.]()
GOES-16 GeoColor image of Hurricane Harvey on August 26, 2017, after it made landfall on the Texas coast. Hurricanes are one of the most menacing natural hazards, especially for island and coastal populations. A warming climate is expected to impact sea level rise, storm surge, tropical cyclone rainfall rates, and tropical cyclone intensity. We are also seeing a pattern of slower storms, remaining stationary over a location for longer periods of time and increasing flooding impacts. This isn’t great news for the millions of people in the paths of hurricanes each year. Fortunately, we have two new advanced geostationary satellites, NOAA’s GOES-16 and GOES-17 that continuously view the entire Atlantic and Eastern/Central Pacific hurricane basins. The latest generation of GOES carry sophisticated instruments that provide new and dramatically improved capabilities for forecasting, tracking and monitoring hurricanes as well as the environmental conditions that cause them to form.
-
May 23, 2019: NOAA Predicts Near-Normal 2019 Atlantic Hurricane Season
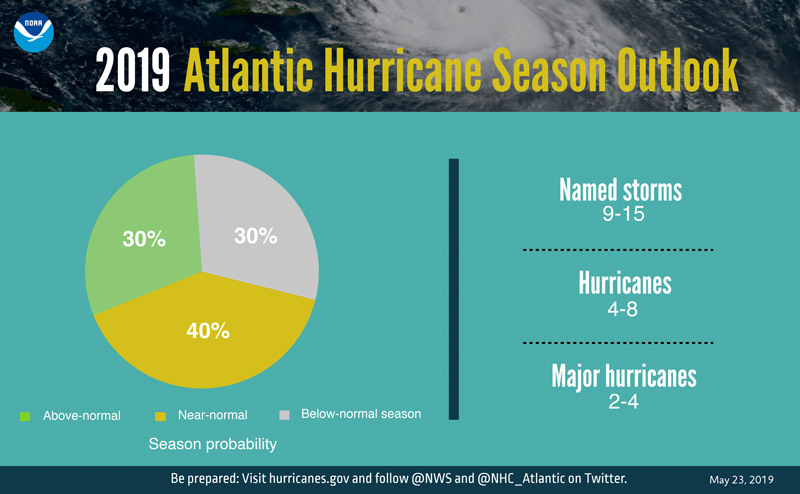
![2019 Atlantic Hurricane Season outlook]()
The 2019 Atlantic hurricane season begins on June 1. The National Oceanic and Atmospheric Administration’s (NOAA‘s) Climate Prediction Center is forecasting a near-normal Atlantic hurricane season. For 2019, NOAA predicts a likely range of 9 to 15 named storms (winds of 39 mph or higher), of which 4 to 8 could become hurricanes (winds of 74 mph or higher), including 2 to 4 major hurricanes (category 3, 4 or 5; with winds of 111 mph or higher). This outlook reflects competing climate factors. The ongoing El Nino is expected to persist and suppress the intensity of the hurricane season. Countering El Nino is the expected combination of warmer-than-average sea-surface temperatures in the tropical Atlantic Ocean and Caribbean Sea, and an enhanced west African monsoon, both of which favor increased hurricane activity. In addition to the Atlantic hurricane season outlook, NOAA also issued the seasonal hurricane outlook for the central Pacific basin. The Central Pacific Hurricane Center announced a 70% chance of above-normal tropical cyclone activity during the central Pacific hurricane season this year and predicted 5 to 8 tropical cyclones for the central Pacific basin.
-
May 14, 2019: GOES-R Cloud and Moisture Imagery Fact Sheet
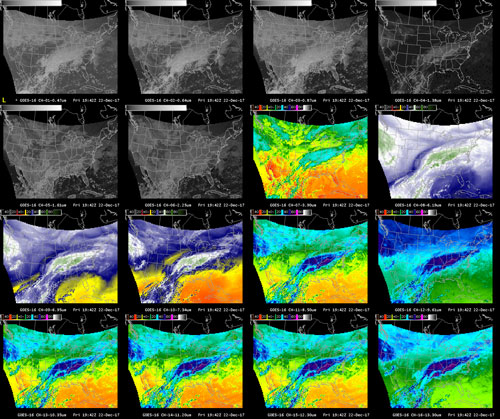
![16 images of the contiguous United States showing each of the ABI spectral bands. Visible imagery is shown in black and white and infrared imagery is colorized according to the features seen in each panel.]()
The 16 spectral bands of the ABI are shown as a 16-panel panel image of the contiguous United States on December 22, 2017 from GOES-16. The first two bands sense in the visible, the following four in the near infrared, and the final ten in the infrared. Cloud and moisture imagery is the satellite imagery that forecasters and the public are accustomed to viewing in weather forecast offices, on the web and in the news. Cloud and moisture imagery includes digital maps of observed land, water and clouds. A new GOES-R cloud and moisture imagery fact sheet explains what types of imagery the Advanced Baseline Imager (ABI) provides. The GOES-R Series ABI measures energy at different wavelengths, which is either reflected (visible and near infrared) or emitted (infrared) from the Earth’s surface. The ABI increases spatial resolution (to better monitor small-scale features), provides faster coverage (to improve temporal sampling and to scan additional regions) and adds spectral bands (to enable new and improved products for a wide range of phenomena). ABI provides advanced measurements of atmospheric and surface conditions such as sea and land surface temperatures, vegetation, clouds, aerosols, hurricanes, winds, water vapor, rainfall, snow and ice cover, fire locations, smoke plumes, volcanic ash and gas, atmospheric temperature and moisture, and ozone.
-
May 14, 2019: GOES-R Aerosols/Air Quality Fact Sheet
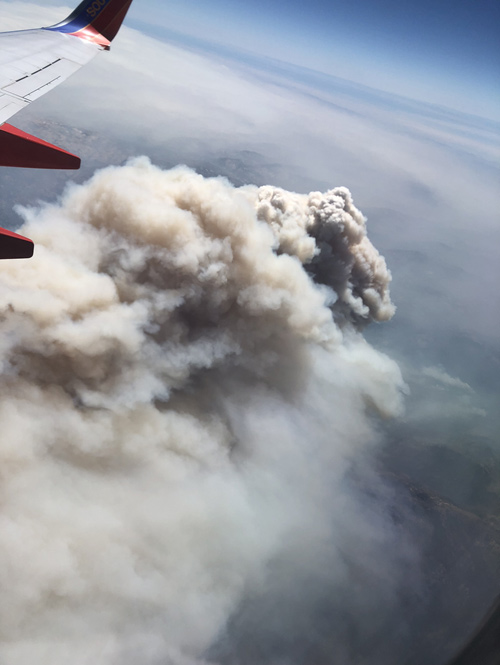
![Large plume of smoke seen from an airplane, with airplane wing in view.]()
Smoke plume from fire near Yosemite National Park, seen from ~25,000 feet on August 5, 2018. The smoke caused such poor air quality that emergency managers were forced to evacuate and close areas of the park. Aerosols are solid and semi-solid particles suspended in the air that have harmful impacts on human health and the environment. GOES-R Series satellites provide a host of aerosol imagery and quantitative retrieval products for air quality monitoring and forecasting applications. A new GOES-R aerosols/air quality applications fact sheet explains how GOES-R satellites enable forecasters to better monitor areas of smoke and dust, which can be critical factors in visibility, aviation and air quality forecasts. In addition to short-term prediction, they also enable better monitoring of the long-term trends in aerosol quantities and distribution throughout the atmosphere to help climate scientists monitor and predict climate change.
-
May 5, 2019: Hurricane Preparedness Week
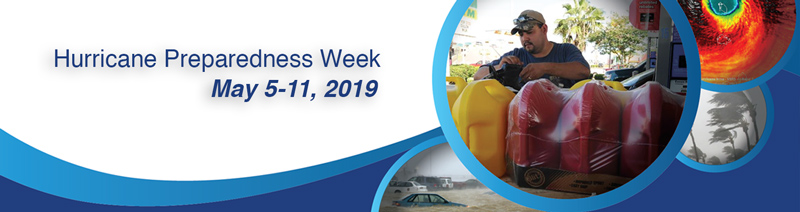
![Hurricane Preparedness Week]()
National Hurricane Preparedness Week is May 5-11, 2019. This is your time to prepare for a potential land-falling tropical storm or hurricane. On each day of this week, NOAA will provide the tips you'll need to get prepared for the hurricane season. Hurricane season begins May 15 in the eastern Pacific, and June 1 for the central Pacific and Atlantic. Visit the Hurricane Preparedness webpage to learn about hurricane hazards and safety and learn how to prepare for the upcoming hurricane season.
May

-
April 29, 2019: NOAA and Air Force Reserve ‘Hurricane Hunters’ to visit East Coast on preparedness tour
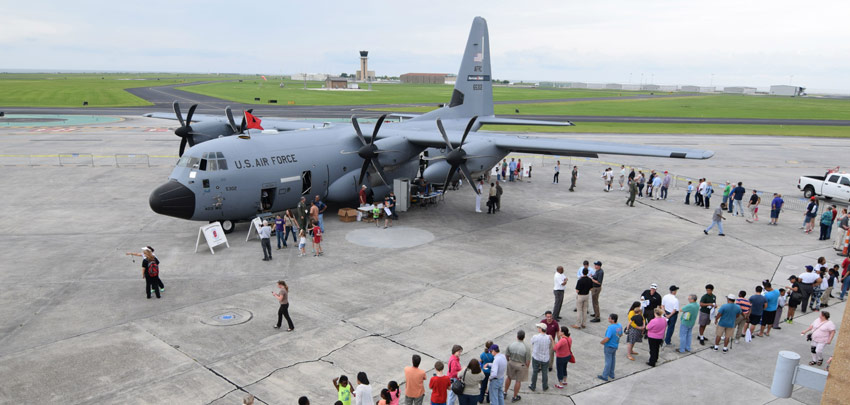
![Earth from geostationary orbit as seen by NASA’s ATS III on the first Earth Day in 1970 (upper left), GOES-3 in 1980 (upper right), GOES-11 in 2011 (lower left) and GOES-16 on Earth Day 2019 (April 22).]()
U.S. Air Force Hurricane Hunter with crowd waiting to tour. In an effort to build a Weather-Ready Nation ahead of this year’s Atlantic hurricane season, NOAA hurricane experts will tour five eastern U.S. cities from May 6-10 to raise awareness of the importance of preparing for the upcoming hurricane season. At each stop, the public and media can take a tour of the “hurricane hunter” aircraft that fly around and directly into the eye of a storm — a NOAA WP-3D Orion aircraft and a U.S. Air Force Reserve WC-130J aircraft.
-
April 22, 2019: Celebrate Earth Day with these Geostationary Satellite Images
![Earth from geostationary orbit as seen by NASA’s ATS III on the first Earth Day in 1970 (upper left), GOES-3 in 1980 (upper right), GOES-11 in 2011 (lower left) and GOES-16 on Earth Day 2019 (April 22).]()
Earth from geostationary orbit as seen by NASA’s ATS III on the first Earth Day in 1970 (upper left), GOES-3 in 1980 (upper right), GOES-11 in 2011 (lower left) and GOES-16 on Earth Day 2019 (April 22). Earth Day was born from former Wisconsin Sen. Gaylord Nelson’s desire to bring environmental issues to the forefront of the national political agenda. The first Earth Day, held on April 22, 1970, was followed by the creation of the U.S. Environmental Protection Agency (EPA) as well as the passage of the Clean Air, Clean Water and Endangered Species Acts. Today, more than 1 billion people will participate in Earth Day activities, raising awareness about critical environmental issues. In celebration of Earth Day, we’re taking a look at just how far satellite imagery has come since 1970.
-
April 22, 2019: 15 Great Reads for Earth Day
![Volcanic arcs and oceanic trenches]()
NOAA celebrates Earth Day 2019. It’s that time again to reacquaint yourself with the health and well-being of our planet. We know what you’re thinking … but it’s not all bad news. NOAA scientists are using their expertise and innovation to help to solve Earth’s biggest challenges. Check out NOAA’s list of useful, fun and fascinating feature stories to pique your interest during Earth Day week, including one on NOAA’s newest operational satellite, GOES-17!
-
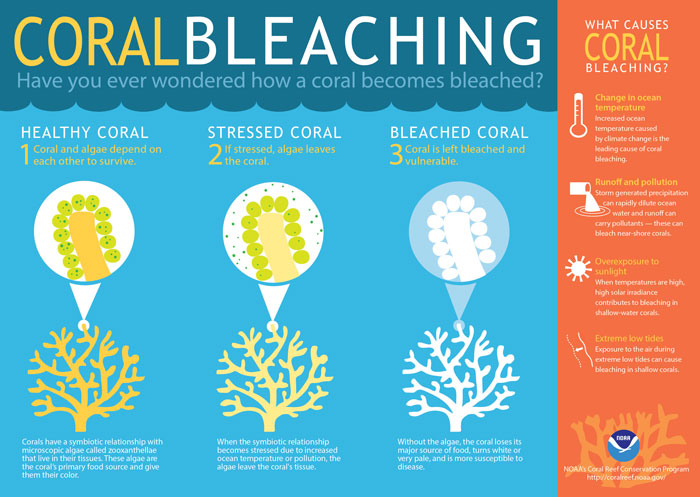
April 19, 2019: How Satellites Play a Pivotal Role in Monitoring the Health of Coral Reefs
![Volcanic arcs and oceanic trenches]()
Coral bleaching process explained. Coral reefs are one of the most productive and biodiverse ecosystems in the world. They cover an estimated 110,000 square miles of the ocean floor and are home to more than 25 percent of marine species for at least some part of their lives. As part of this year’s Earth Day theme, “Protect Our Species,” we’re looking at how NOAA’s satellites are monitoring the effects of climate change on coral reefs around the globe. Using a combination of NOAA and international partners’ satellites, Coral Reef Watch can monitor ocean temperatures and identify areas at risk for coral bleaching. The Advanced Baseline Imager (ABI) aboard the GOES-R satellite series and NOAA-20’s Visible Infrared Imaging Radiometer Suite (VIIRS) provide data on ocean temperatures by looking at the infrared radiation that’s emitted from the ocean.
-
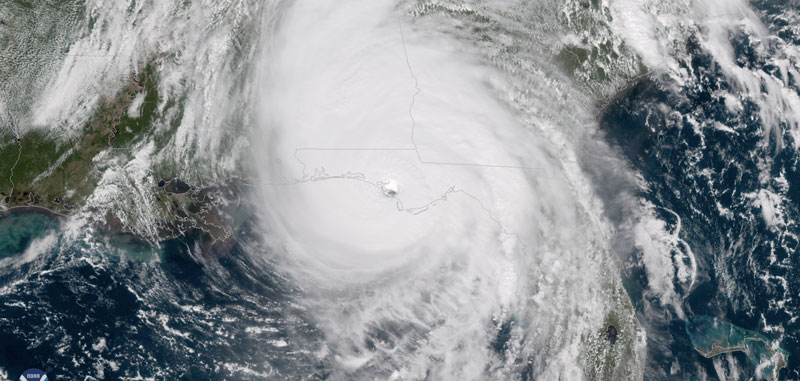
April 19, 2019: Hurricane Michael Upgraded to a Category 5 at Time of U.S. Landfall
![Volcanic arcs and oceanic trenches]()
GOES-16 imagery of Hurricane Michael at time of landfall. Scientists at NOAA’s National Hurricane Center conducted a detailed post-storm analysis on all the data available for Hurricane Michael and have determined that the storm’s estimated intensity at landfall was 160 mph. This makes Michael a category 5 storm on the Saffir-Simpson Hurricane Wind Scale at the time of landfall on October 10, 2018, near Mexico Beach and Tyndall Air Force Base, Florida. Michael was the first hurricane to make landfall in the United States as a Category 5 since Hurricane Andrew in 1992, and only the fourth on record.
-
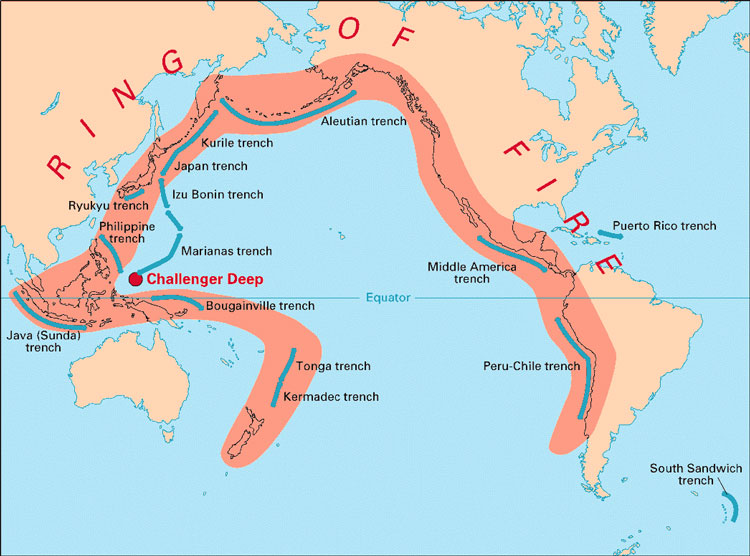
April 16, 2019: New Tools for Monitoring Volcanic Ash
![Volcanic arcs and oceanic trenches]()
Volcanic arcs and oceanic trenches partly encircling the Pacific Basin form the so-called Ring of Fire, a zone of frequent earthquakes and volcanic eruptions. (Courtesy of USGS) Volcanic ash is a significant health, aviation, infrastructure and economic hazard. GOES East and GOES West observe a significant fraction of the most volcanically active region on Earth, known as the “Pacific Ring of Fire.” New capabilities from the GOES-16 and GOES-17 Advanced Baseline Imager and Geostationary Lightning Mapper provide improved volcanic hazard forecasting and monitoring through sophisticated new data products and automated detection tools. As forecasters gain more experience with new GOES-R Series datasets, the value of the measurements will increase significantly, resulting in safer and more efficient air transportation and a better understanding of volcanic processes and the complex relationship between volcanic emissions and weather and climate.
-
April 8, 2019: NOAA’s 2018 Business Brief
![NOAA’s improved performance in understanding and predicting extreme weather and water events is critical]()
NOAA’s improved performance in understanding and predicting extreme weather and water events is critical. What does NOAA do for you? NOAA provides timely and reliable information based on sound science to communities and businesses every day. From daily weather forecasts, severe storm warnings, and climate monitoring to fisheries management, coastal restoration and supporting marine commerce, Americans rely on NOAA. GOES-16 and GOES-17 helped NOAA respond to extreme weather events in 2018 and contributed to improving NOAA’s observational infrastructure. View a story map version of NOAA’s 2018 Business Brief.
-
April 8, 2019: 1st Quarter 2019 GOES-R Program Newsletter
![GOES 17 animiation of Atmospheric river event]()
GOES West water vapor imagery of bomb cyclone on March 13, 2019. The GOES-R Series Program quarterly newsletter for January – March 2019 is now available. GOES-17 is now operational as GOES West and we now have advanced geostationary satellite capabilities for more than half the globe. The program remains as busy as ever, with the team continuing to work on GOES-16 and 17 data product validation, the ground system server refresh, the GOES-T/U Advanced Baseline Imager cooling system redesign, and the build of our next two satellites in order to ensure continuity of GOES-R series operations for many years to come.
-
April 3, 2019: GOES-16 Monitors Record Flooding in the Midwest
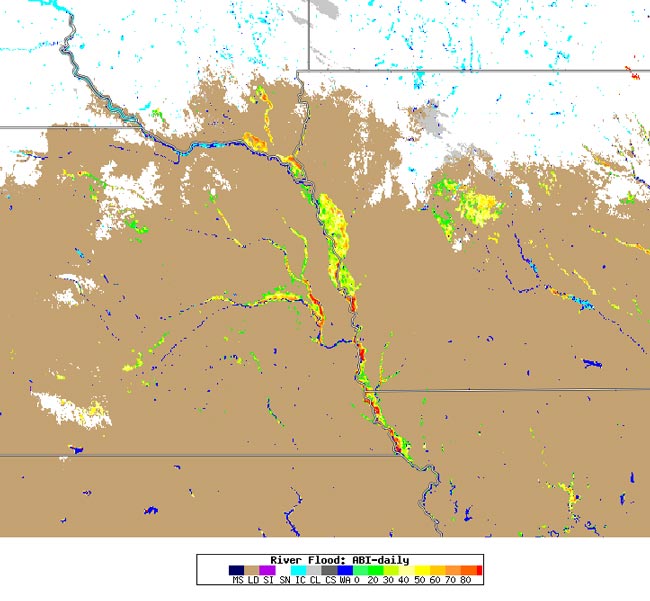
![GOES 17 animiation of Atmospheric river event]()
Flooding in southeastern South Dakota, eastern Nebraska, and western/central Iowa is seen in this ABI daily river flood map on March 16, 2019. Flooding is seen in yellow, green, orange and red. Brown is land, and dark blue is normal water levels within bodies of water. White is snow cover, with ice shown in cyan. Credit: Sanmei Li and Donglian Sun, George Mason University and SSEC/RealEarth The National Weather Service (NWS) is reporting an accelerated flood season across the Midwestern United States. On March 13, 2019, a winter storm system intensified and swept across much of the Central U.S., causing heavy rain, severe thunderstorms, snow, and blizzard conditions. The storm led to widespread flooding across parts of South Dakota, Nebraska and Iowa. New flood products, utilizing GOES-R Series and JPSS data, are helping forecasters better determine where and when flooding will occur and aiding officials in determining where to deploy resources during a flood event.
-
April 2, 2019: Case Study: Saving GOES-17
![GOES 17 animiation of Atmospheric river event]()
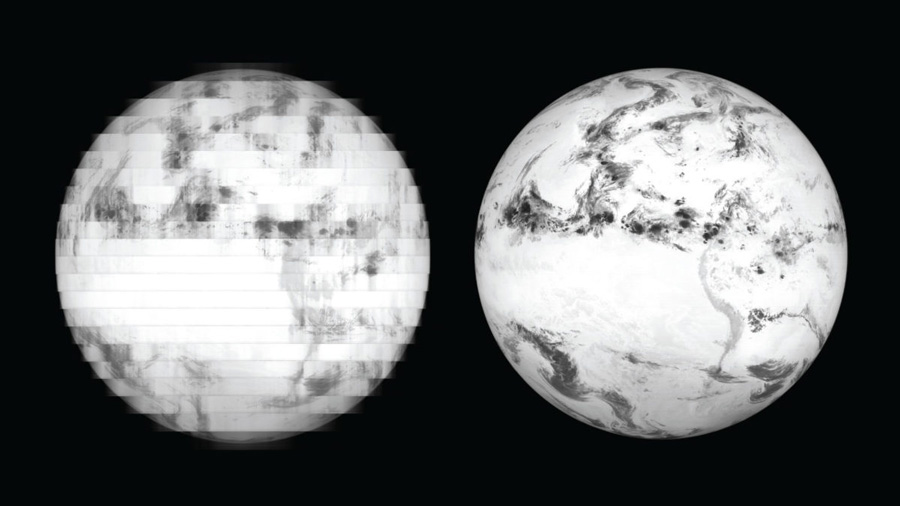
GOES-17 ABI elevated detector temperatures (left) resulted in blurred images. The GOES team solved the issue by adjusting the voltage that controls the flow of photocurrent (right). Aerospace America published an article “Saving GOES-17,” authored by John Van Naarden, Advanced Baseline Imager chief engineer at Harris Corp., and Dan Lindsey, NOAA’s senior scientific advisor to the GOES-R Program. The article outlined the issues that were discovered with the cooling system on GOES-17’s primary instrument, the Advanced Baseline Imager, and efforts to improve performance of the instrument. Despite a thermal system operating at only about 5% of its capacity, ABI is now delivering more than 97% of its intended data, thanks to recovery efforts.
-
April 2, 2019: New ABI Scan Mode
On April 2, 2019, the GOES-16 and GOES-17 Advanced Baseline Imagers began operating in a new scan mode, 10-minute flex mode. Ten-minute flex mode is very similar to the previous default flex mode with one exception: a full disk image is generated every 10 minutes instead of every 15 minutes. Contiguous U.S. (CONUS) for GOES-16/ Pacific U.S. (PACUS) for GOES-17 scans (3000 km by 50000 km) are still provided every five minutes, in addition to two mesoscale domains (1000 km by 1000 km) every 60 seconds (or one domain every 30 seconds if scanning the same domain). The new scan mode allows NOAA to match the full-disk scanning cadence of our international partners and will be critical to National Weather Service Weather Forecast Offices, National Centers, and the Volcanic Ash Advisory Centers in monitoring hazardous weather conditions and providing additional information in observationally limited areas.
April


-
March 20, 2019: NOAA’s Spring 2019 Flood and Climate Outlook
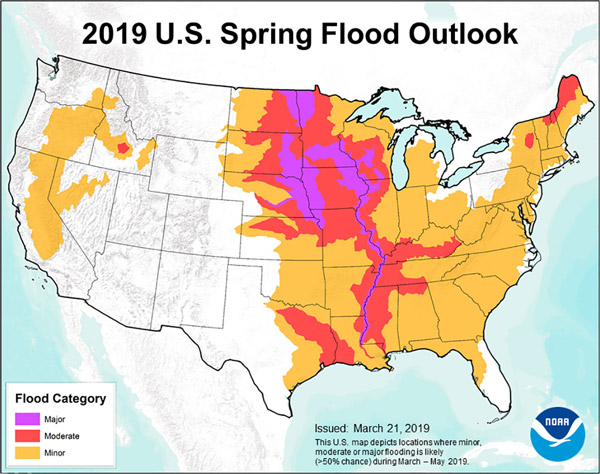
![NOAA’s 2019 Spring Flood Outlook map depicts the locations where there is a greater than 50% change of major, moderate or minor flooding March through May 2019.]()
NOAA’s 2019 Spring Flood Outlook map depicts the locations where there is a greater than 50% change of major, moderate or minor flooding March through May 2019. According to NOAA's spring flood and climate outlook, a wet winter has primed much of the Great Plains for spring flooding in 2019, with major flooding likely along the Red River of the North, the Missouri, and the Mississippi Rivers. Moderate flood risk extends upstream of those rivers to their tributaries, including the lower Ohio, the Cumberland, and Tennessee Rivers. Minor flood risk covers nearly the entire country east of the Mississippi as well as parts of Washington, Oregon, and California.
-
March 19, 2019: GOES-16 and GOES-17 Used in Drought Monitoring and Prediction
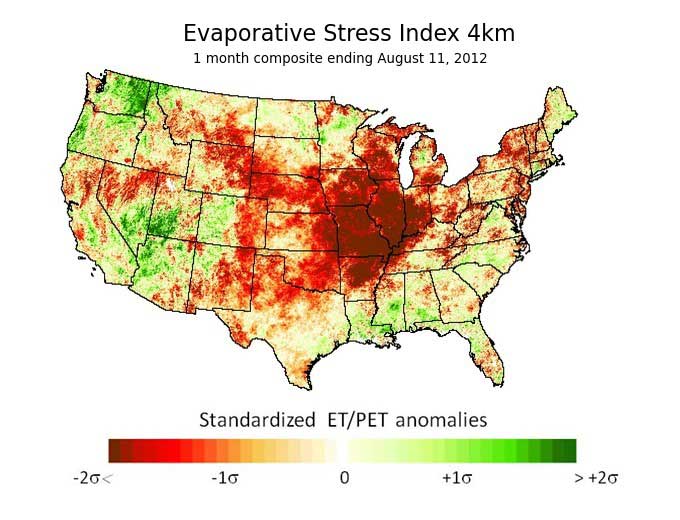
![GOES-16 and GOES-17 Used in Drought Monitoring and Prediction]()
Evaporative Stress Index (ESI) depiction of the 2012 flash drought event across the Midwestern U.S. Red and brown colors indicate extreme moisture stress. Credit: USDA Researchers are using satellite data to alert farmers and ranchers about impending flash droughts. Thermal infrared imagery from both the GOES-R Series satellites, as well as polar orbiting satellites like NOAA-20 and Suomi-NPP, is used to estimate evapotranspiration, which is a measure of how much water is being transferred from the land to the atmosphere through the soil and plants. Using a tool called the Evaporative Stress Index (ESI), it’s now possible to deliver a probabilistic forecast, like the ones we get from the National Weather Service, a month or so ahead of the onset of a flash drought. New tools and better forecasts give the agricultural sector even more options to deal with drought and can help mitigate their future impact.
-
March 5, 2019: NOAA Talks Hurricanes and Climate at National Press Club
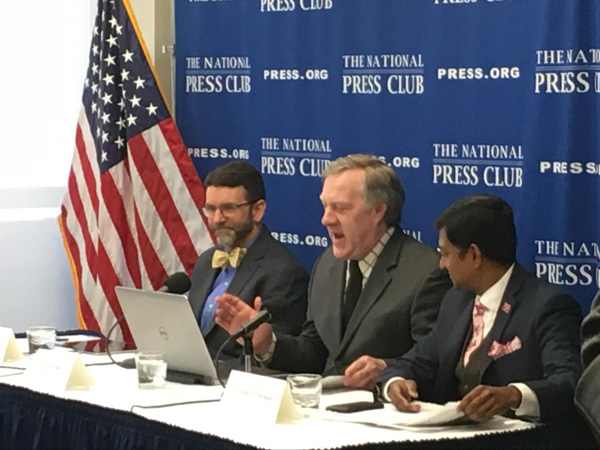
![From left, Jeremy Gregory, Ph.D., Gerry Bell, Ph.D, and moderator Ferdous Al-Faruque at the National Press Club on March 5, 2019.]()
From left, Jeremy Gregory, Ph.D., Gerry Bell, Ph.D, and moderator Ferdous Al-Faruque at the National Press Club on March 5, 2019. Each year, NOAA helps the United States prepare for hurricanes by issuing a seasonal outlook before the official start of the season on June 1. Gerry Bell, Ph.D., from NOAA’s Climate Prediction Center, spoke to reporters at the National Press Club on March 5 about how NOAA creates this outlook and the climate drivers that fuel or suppress a hurricane season. Bell said the Atlantic remains in a period of increased hurricane activity that began in 1995 and generates more, stronger, and longer-lived storms. Bell also identified several global climate patterns that can drive hurricane development within that high-activity era. The Atlantic Multi-decadal Oscillation (AMO) influences hurricane seasons over several decades and the El Nino/Southern Oscillation (ENSO) drives year-to-year variability. “By predicting key climate patterns, we can often predict these regional hurricane-controlling conditions, and therefore predict the strength of the upcoming hurricane season,” he said.
-
March 4, 2019: A Long View of California’s Climate: Study Examines Centuries of Data to Understand Climate-Wildfire Links
![From left, Jeremy Gregory, Ph.D., Gerry Bell, Ph.D, and moderator Ferdous Al-Faruque at the National Press Club on March 5, 2019.]()
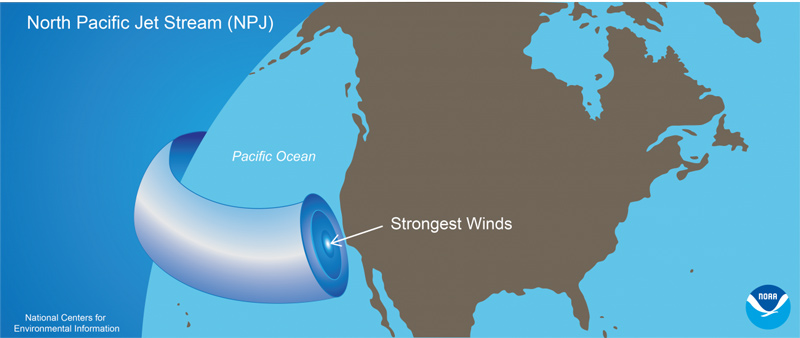
The North Pacific Jet (NPJ) travels eastward at variable wind speeds and directions toward California at an altitude of about 11 kilometers above the ocean’s surface. The strength and position of the winds take on importance in relation to the amount and intensity of moisture the jet stream delivers. This graphic represents a winter-average path of entry to California that could produce a very-wet, low-fire season in the state. Courtesy of NOAA NCEI. Deadly severe wildfires in California have scientists scrutinizing the underlying factors that could influence future extreme events. Using climate simulations and paleoclimate data dating back to the 16th century, a recent study looks closely at long-term upper-level wind and related moisture patterns to find clues. New research published by the Proceedings of the National Academy of Sciences USA examines jet stream and moisture patterns in California over a centuries-long time period—1571 to 2013. The work provides a stronger foundation and a longer-term perspective for evaluating regional natural hazards within California and the economic risks to one of the world's largest economies.
March
-
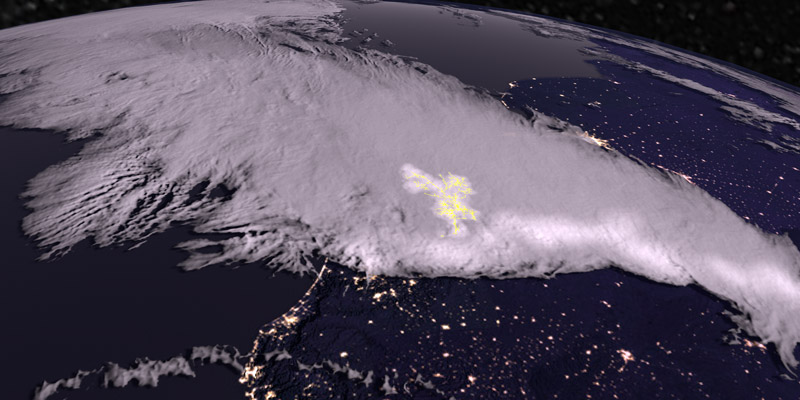
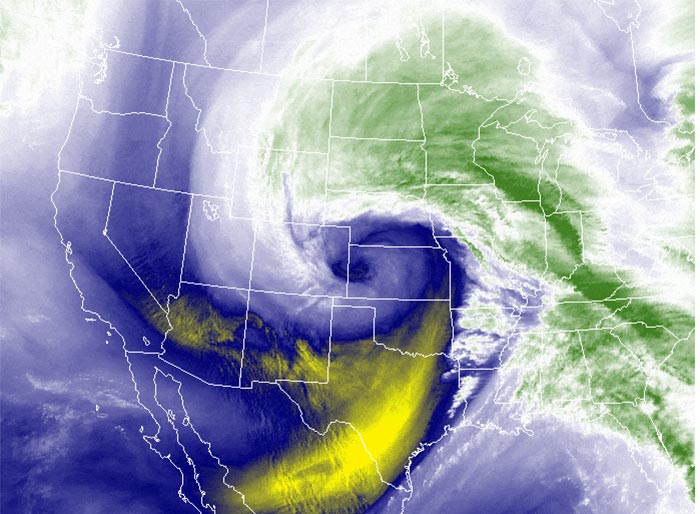
February 20, 2019: Keeping an Eye on Rivers in the Sky
Atmospheric rivers are long, narrow conveyor belts of moisture that move through the atmosphere. Strong atmospheric rivers can deliver enormous amounts of rain and high-elevation snow in California, Pacific Northwest, and Alaska, especially during the winter months. The GOES-R Series Advanced Baseline Imager provides improved detection and monitoring of atmospheric river events. Understanding and anticipating the role of atmospheric rivers is important for water and emergency management on the West Coast, particularly in California. GOES-17, recently designated NOAA’s GOES West operational satellite, is positioned to keep an eye on the western U.S., Alaska and Pacific Ocean, and provide advanced monitoring of atmospheric rivers among other weather phenomena and hazards.
-
February 14, 2019: NOAA Satellites Helped Rescue 340 People in 2018
![NOAA Satellites Helped Rescue 340 People in 2018]()
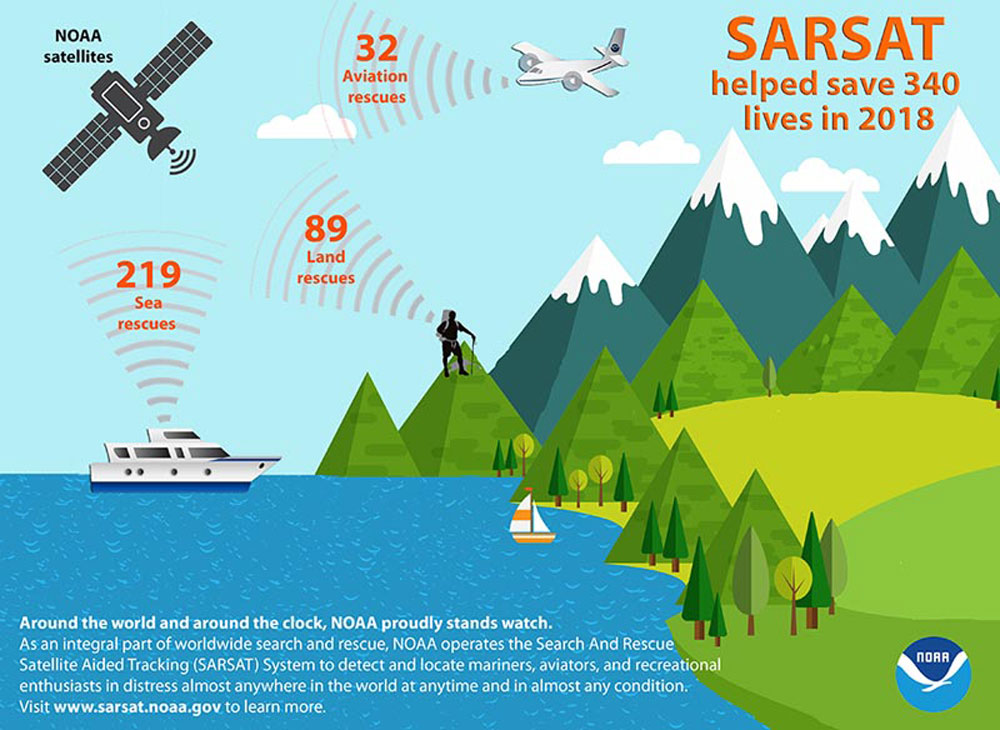
SARSAT rescues for 2018. In 2018, the NOAA Search and Rescue Satellite Aided Tracking (SARSAT) system helped save 340 lives with the aid of NOAA satellites like GOES-16. In addition to carrying instruments for monitoring our atmosphere, land and oceans for severe weather and other hazards, GOES-16 also carries a SARSAT transponder to help locate people in distress. This transponder provides the capability to immediately detect distress signals from emergency beacons and relay them to ground stations. In turn, this signal is routed to a SARSAT mission control center and then sent to a rescue coordination center, which dispatches a search and rescue team to the location of the distress.
-
February 12, 2019: GOES-17 is Now Operational as NOAA’s GOES West!
![GOES-17 is Now Operational as NOAA’s GOES West]()
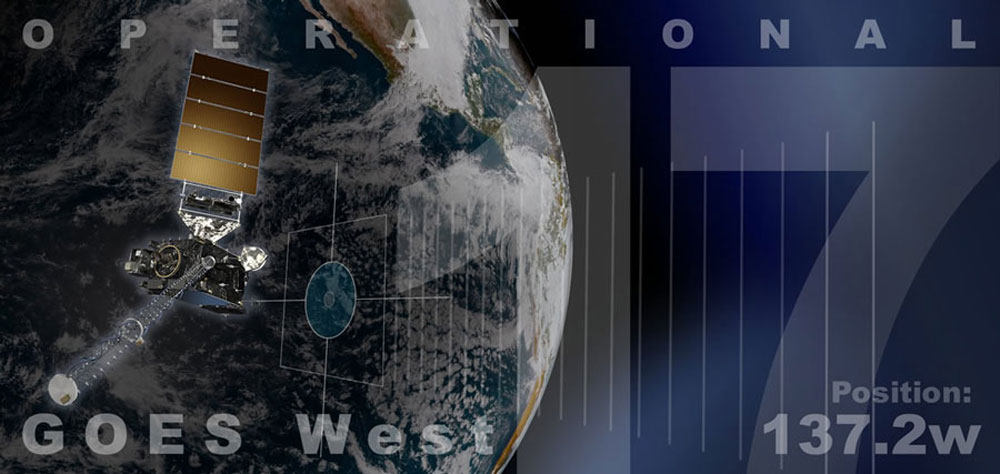
GOES-17 is now operational as NOAA’s GOES West! GOES-17 is now operational as NOAA’s GOES West. In its new role, GOES-17 is providing faster, more accurate, and more detailed observations for detecting and monitoring Pacific storm systems, fog, wildfires, and other weather phenomena that affect the western United States, Alaska, and Hawaii. Located at 137.2 degrees west longitude, GOES-17 replaces GOES-15 as NOAA’s operational GOES West. GOES-17 joins GOES-16, in operations as NOAA’s GOES East, in delivering high-resolution visible and infrared imagery and lightning observations of more than half the globe – from the west coast of Africa to New Zealand and from near the Arctic Circle to the Antarctic Circle. View GOES-17 operational imagery.
-
February 6, 2019: Assessing the Global Climate in 2018
![Assessing the Global Climate in 2018]()
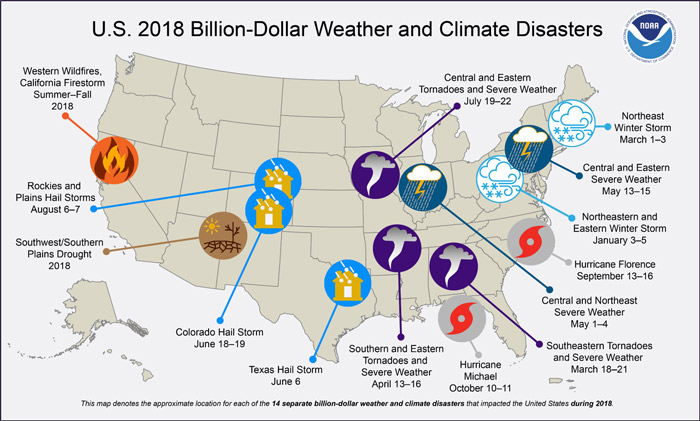
The United States experienced 14 billion-dollar weather disasters in 2018, which resulted in the deaths of at least 247 people and approximately $91 billion in damage. (NOAA NCEI) For the globe, 2018 became the fourth warmest year on record and the United States experienced 14 billion-dollar weather and climate disasters. These are findings from the 2018 Annual Global Climate Report from NOAA National Centers for Environmental Information, which is part of the suite of climate services NOAA provides to government, business, academia and the public to support informed decision-making. Earth’s long-term warming trend continued in 2018 as persistent warmth across large swaths of land and ocean resulted in the globe’s fourth hottest year in NOAA’s 139-year climate record. The year ranks just behind 2016 (warmest), 2015 (second warmest) and 2017 (third warmest). In separate analyses of global temperatures, scientists from NASA, the United Kingdom Met Office and the World Meteorological Organization also reached the same heat ranking.
-
February 5, 2019: GOES East Sees Partial Solar Eclipse
Shadow of the moon as it passes in front of the sun on February 5. GOES East captured a partial solar eclipse on February 5, 2019. In this animation from the satellite’s Solar Ultraviolet Imager (SUVI) instrument, you can see the moon passing across the sun. A partial eclipse occurs when the sun and moon are not exactly in line with the Earth and the moon only partially obscures the sun.
-
February 5, 2019: GOES-16 Detects Meteor over Cuba
Meteor over Cuba captured by the GOES-16 GLM instrument. On February 1, 2019, at 1:17 p.m. EST, the GOES-16 Geostationary Lightning Mapper (GLM) detected a bright meteor over northwestern Cuba. The meteorite landed near Viñales, Pinar del Río in western Cuba. While designed for mapping lightning flashes, GLM can observe large meteors anywhere throughout its coverage area. The instrument takes 500 images of Earth every second, allowing it to measure the shape of a meteor “light curve,” or the change in brightness of a meteor with time, with millisecond precision.
The GOES-16 Advanced Baseline Imager also detected the airborne debris cloud as it drifted northeastward then eastward for about an hour after the impact. The signatures in the split cloud top phase and split window imagery were due to the presence of mineral dust particles within the debris cloud — the emissivity properties of dust affects the sensed brightness temperatures differently for various infrared spectral bands. The cirrus spectral band is useful for detecting the scattering of light by airborne particles such as ice crystals, volcanic ash, smoke or dust. The debris cloud was also casting a subtle shadow onto the surface, as seen in the visible imagery.
February
-
January 31, 2019: The latest GOES-R Series Quarterly Newsletter is now available for download
![GOES-17 Shares First Images of Hawaii]()
GOES-17 Shares First Images of Hawaii The GOES-R Series Program quarterly newsletter for the time period October – December 2018 is now available. GOES-17 completed its Handover Readiness Review and the program handed the satellite over to NOAA’s Office of Satellite and Product Operations. GOES-17 is now in its operational location at 137.2 west and is providing stunning imagery of the U.S. West Coast, Alaska, Hawaii, and even New Zealand. The satellite is ready for operations as NOAA’s GOES West.
-
January 28, 2019: Joint NOAA/AMS/EUMETSAT Satellite Conference Call for Abstracts
This conference merges three satellite conferences into one major event. NOAA, the American Meteorological Society (AMS) Satellite Meteorology, Oceanography, and Climatology (SatMetOC), and the European Organisation for the Exploitation of Meteorological Satellites (EUMETSAT) will hold a joint conference September 29 – October 4, 2019, in Boston. Abstract submissions are due on March 1, 2019.
